


- News

- Economy

- Central Banks
- Investing
- Research
- Roundups
- Digital Currency
- Insights
- Technical Analysis
- Technology
- Business
- Law
- Health
- Nature
- Fintech
- Science
- Topic
- Opinions
- ©Econometrics LLC . All Rights Reserved.
FxWirePro: EUR/SEK remains well supported below 9.49 mark, sustained break above targets 9.5183
Aug 17, 2016 07:43 am UTC| Technicals
EUR/SEK is currently trading around 9.4793 levels. It made intraday high at 9.4918 and low at 9.4583 levels. Intraday bias remains bearish till the time pair holds key resistance at 9.4918 marks. A daily...
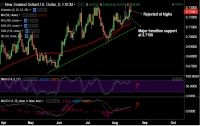
FxWirePro: NZD/USD rejected at session high, slips below 0.73 handle
Aug 17, 2016 07:26 am UTC| Technicals
Broad-based USD strength after hawkish Fed comments keeps NZD/USD subdued. Data released earlier today showed unemployment rate fell to 5.1% and PPI rose 0.9% q/q versus expected 0.5% rise. Kiwi largely muted to...
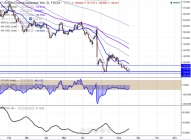
FxWirePro: GBP/JPY upside capped by 9- day EMA, good to sell on rallies
Aug 17, 2016 07:01 am UTC| Technicals
Major resistance 132.10 (9 day EMA). The pair has recovered sharply after making a low of 129.06 yesterday. It is currently trading around 129.61. Yen continues to surge against all major pairs as weakness in...
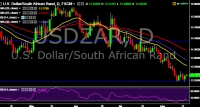
FxWirePro: USD/ZAR almost flat at 13.40, intraday bias remains neutral
Aug 17, 2016 06:56 am UTC| Technicals
USD/ZAR is currently trading around 13.41 levels. It made intraday high at 13.45 and low at 13.38 levels. Intraday bias remains neutral till the time pair holds key support at 13.19 levels. A daily close...
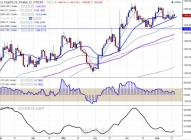
FxWirePro: Gold faces strong resistance at $1358, good to sell on rallies
Aug 17, 2016 06:31 am UTC| Technicals
Major resistance - $1368. Major support - $1330. The yellow metal has once again retreated till $1340 at the time of writing after making a high of $1357.96 yesterday and it is currently trading at...
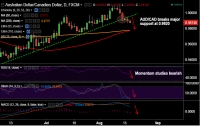
FxWirePro: AUD/CAD breaks major support at 0.9920, scope for drop till 0.9775
Aug 17, 2016 06:30 am UTC| Technicals
AUD/CAD has broken major trendline support at 0.9920, intraday bias lower. Technical indicators support downside in the pair. RSI and Stochs are biased lower, MACD shows a bearish crossover. Major support on the...
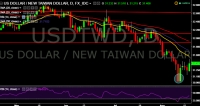
Aug 17, 2016 06:03 am UTC| Technicals
USD/TWD is currently trading around 31.42 marks. It made intraday high at 31.51 and low at 31.21 marks. Intraday bias remains bullish till the time pair holds key support at 31.21 marks. A sustain close...


China Extends Gold Buying Streak as Reserves Surge Despite Volatile Prices

Trump Lifts 25% Tariff on Indian Goods in Strategic U.S.–India Trade and Energy Deal

Trump Signs Executive Order Threatening 25% Tariffs on Countries Trading With Iran

U.S.-India Trade Framework Signals Major Shift in Tariffs, Energy, and Supply Chains

Dow Hits 50,000 as U.S. Stocks Stage Strong Rebound Amid AI Volatility


New York Legalizes Medical Aid in Dying for Terminally Ill Patients

Trump Says “Very Good Talks” Underway on Russia-Ukraine War as Peace Efforts Continue

China Warns US Arms Sales to Taiwan Could Disrupt Trump’s Planned Visit

Trump Allows Commercial Fishing in Protected New England Waters

SpaceX Prioritizes Moon Mission Before Mars as Starship Development Accelerates

NASA and SpaceX Target Crew-11 Undocking From ISS Amid Medical Concern

Neuralink Plans High-Volume Brain Implant Production and Fully Automated Surgery by 2026

Jared Isaacman Confirmed as NASA Administrator, Becomes 15th Leader of U.S. Space Agency
Senate Sets December 8 Vote on Trump’s NASA Nominee Jared Isaacman
Nvidia CEO Jensen Huang Says AI Investment Boom Is Just Beginning as NVDA Shares Surge

Amazon Stock Rebounds After Earnings as $200B Capex Plan Sparks AI Spending Debate

Global PC Makers Eye Chinese Memory Chip Suppliers Amid Ongoing Supply Crunch

OpenAI Expands Enterprise AI Strategy With Major Hiring Push Ahead of New Business Offering

SoftBank Shares Slide After Arm Earnings Miss Fuels Tech Stock Sell-Off


- Market Data


