


- News

- Economy

- Central Banks
- Investing
- Research
- Roundups
- Digital Currency
- Insights
- Technical Analysis
- Technology
- Business
- Law
- Health
- Nature
- Fintech
- Science
- Topic
- Opinions
- ©Econometrics LLC . All Rights Reserved.
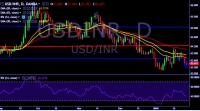
FxWirePro: USD/INR breaks key support at 63.48 mark, bias remains slightly bearish
Jan 25, 2018 07:16 am UTC| Technicals
USD/INR is currently trading around 63.49 marks. It made intraday high at 63.49 and low at 63.39 marks. Intraday bias remains bearish till the time pair holds key resistance at 63.72 mark. Key resistances...
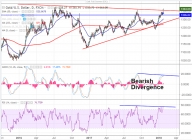
FxWirePro: Gold hits 1-1/2 year high, good to buy on dips
Jan 25, 2018 07:00 am UTC| Technicals
Chart Pattern Bearish Divergence (RSI and MACD). Gold has shown a huge jump almost $20 after hitting low of $1324. The yellow metal has broken the high of $1357 high made on Sep 8th 2017. US dollar index has been...
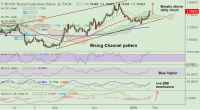
FxWirePro: GBP/AUD consolidates above daily cloud, weakness only on break below 50-DMA
Jan 25, 2018 06:30 am UTC| Technicals
GBP/AUD is trading in an extremely narrow range, intraday bias remains neutral. The pair is consolidating break above daily Ichimoku cloud, scope for further upside. Strong UK labour market data giving the...
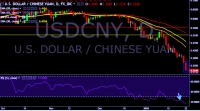
FxWirePro: USD/CNY hovers around 6.32 mark, hits lowest level since November 2015
Jan 25, 2018 06:10 am UTC| Technicals
USD/CNY is currently trading around 6.3229 marks. It made intraday high at 6.3649 and low at 6.3215 levels. Intraday bias remains bearish till the time pair holds key resistance at 6.3649 mark. A sustained...
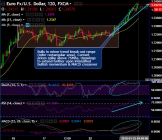
Jan 25, 2018 06:00 am UTC| Technicals
The minor trend of EURUSD manages to break-out above range (refer 4H chart in the rectangular area), consequently, the current prices have spiked above 7SMAs. For now, the upswings are most likely to extend further upon...
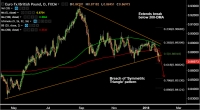
FxWirePro: EUR/GBP breaks 'Symmetric Triangle' pattern, hovers around 61.8% Fib, bias lower
Jan 25, 2018 05:45 am UTC| Technicals
EUR/GBP trades in a narrow range, consolidates previous sessions downside, bias still bearish. The pair has shown a breakout of Symmetric Triangle pattern and has breached major support at 0.8765 (Triangle...
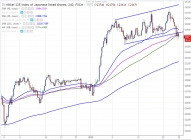
FxWirePro: Nikkei breaks trend lien support, good to sell on rallies
Jan 25, 2018 05:43 am UTC| Technicals
Nikkei has shown a minor decline of almost 500 points after hitting high of 24122. The major reason for slight decline was due to huge sell off in USD/JPY pair. US SP 500 has shown a minor sell-off from the all-time high...


China Extends Gold Buying Streak as Reserves Surge Despite Volatile Prices

Trump Lifts 25% Tariff on Indian Goods in Strategic U.S.–India Trade and Energy Deal

Trump Signs Executive Order Threatening 25% Tariffs on Countries Trading With Iran

U.S.-India Trade Framework Signals Major Shift in Tariffs, Energy, and Supply Chains

Dow Hits 50,000 as U.S. Stocks Stage Strong Rebound Amid AI Volatility


New York Legalizes Medical Aid in Dying for Terminally Ill Patients

Trump Says “Very Good Talks” Underway on Russia-Ukraine War as Peace Efforts Continue

China Warns US Arms Sales to Taiwan Could Disrupt Trump’s Planned Visit

Trump Allows Commercial Fishing in Protected New England Waters

SpaceX Prioritizes Moon Mission Before Mars as Starship Development Accelerates

NASA and SpaceX Target Crew-11 Undocking From ISS Amid Medical Concern

Neuralink Plans High-Volume Brain Implant Production and Fully Automated Surgery by 2026

Jared Isaacman Confirmed as NASA Administrator, Becomes 15th Leader of U.S. Space Agency
Senate Sets December 8 Vote on Trump’s NASA Nominee Jared Isaacman
Nvidia CEO Jensen Huang Says AI Investment Boom Is Just Beginning as NVDA Shares Surge

Amazon Stock Rebounds After Earnings as $200B Capex Plan Sparks AI Spending Debate

Global PC Makers Eye Chinese Memory Chip Suppliers Amid Ongoing Supply Crunch

OpenAI Expands Enterprise AI Strategy With Major Hiring Push Ahead of New Business Offering

SoftBank Shares Slide After Arm Earnings Miss Fuels Tech Stock Sell-Off


- Market Data


