


- News

- Economy

- Central Banks
- Investing
- Research
- Roundups
- Digital Currency
- Insights
- Technical Analysis
- Technology
- Business
- Law
- Health
- Nature
- Fintech
- Science
- Topic
- Opinions
- ©Econometrics LLC . All Rights Reserved.
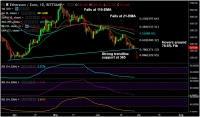
FxWirePro: ETH/EUR trades with bearish bias, break below 365 to see resumption of weakness
Jun 28, 2018 04:57 am UTC| Digital Currency Technicals
ETH/EUR trades in narrow range, with the days high at 383 and low at 372 levels. The pair is trading with a bearish bias, but is struggling to break strong trendline support at 365 level. Price action extends in...
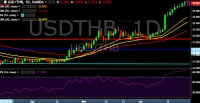
FxWirePro: USD/THB remains well supported above 33.00 mark, good to buy on dips
Jun 28, 2018 04:53 am UTC| Technicals
USD/THB is currently trading around 33.05 marks. It made intraday high at 33.07 and low at 33.01 marks. Intraday bias remains bullish till the time pair holds key support at 32.90 mark. On the top side, key...
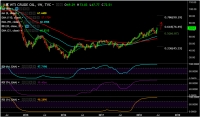
FxWirePro: US Oil tops $73 a barrel, highest since November 2014
Jun 28, 2018 04:40 am UTC| Technicals
US oil clocked fresh multi-year highs above $73 a barrel overnight. Oil prices spiked higher as EIA data reports biggest weekly drop in U.S. crude supplies year to date. U.S. crude stocks fell by nearly 10...
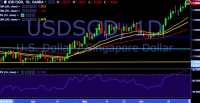
FxWirePro: USD/SGD hits fresh 8-month high at 1.3684 mark, stay bullish
Jun 28, 2018 03:40 am UTC| Technicals
USD/SGD is currently trading around 1.3670 marks. It made intraday high at 1.3684 and low at 1.3658 levels. Intraday bias remains bullish till the time pair holds key support at 1.3616 mark. A daily close...
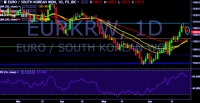
FxWirePro: EUR/KRW slips below 1,300 mark, bias turns bearish again
Jun 28, 2018 02:21 am UTC| Technicals
EUR/KRW is currently trading around 1,294 mark. Pair made intraday high at 1,298 and low at 1,294 levels. Intraday bias remains bearish till the time pair holds key resistance at 1,302 mark. A sustained...


South Africa Eyes ECB Repo Lines as Inflation Eases and Rate Cuts Loom

Russian Stocks End Mixed as MOEX Index Closes Flat Amid Commodity Strength

China Extends Gold Buying Streak as Reserves Surge Despite Volatile Prices

Trump Lifts 25% Tariff on Indian Goods in Strategic U.S.–India Trade and Energy Deal

Trump Signs Executive Order Threatening 25% Tariffs on Countries Trading With Iran


New York Legalizes Medical Aid in Dying for Terminally Ill Patients

Trump Says “Very Good Talks” Underway on Russia-Ukraine War as Peace Efforts Continue

China Warns US Arms Sales to Taiwan Could Disrupt Trump’s Planned Visit

Trump Allows Commercial Fishing in Protected New England Waters

SpaceX Prioritizes Moon Mission Before Mars as Starship Development Accelerates

NASA and SpaceX Target Crew-11 Undocking From ISS Amid Medical Concern

Neuralink Plans High-Volume Brain Implant Production and Fully Automated Surgery by 2026

Jared Isaacman Confirmed as NASA Administrator, Becomes 15th Leader of U.S. Space Agency
Senate Sets December 8 Vote on Trump’s NASA Nominee Jared Isaacman
Nvidia CEO Jensen Huang Says AI Investment Boom Is Just Beginning as NVDA Shares Surge

Amazon Stock Rebounds After Earnings as $200B Capex Plan Sparks AI Spending Debate

Global PC Makers Eye Chinese Memory Chip Suppliers Amid Ongoing Supply Crunch

OpenAI Expands Enterprise AI Strategy With Major Hiring Push Ahead of New Business Offering

SoftBank Shares Slide After Arm Earnings Miss Fuels Tech Stock Sell-Off


- Market Data


