


 FxWirePro- Major Crypto levels and bias summary
  FxWirePro- Major Crypto levels and bias summary
  BTCUSD Coils in Tight Range: Will Geopolitical Stability Trigger a Breakout Toward $80,000?
  Ethereum Trails Bitcoin’s Retreat: Key Support Levels in Focus
  Ethereum Retreats in Bitcoin’s Shadow: ETH/USD Tests Critical Support at USD 2,075
  Bitcoin Retreats as Geopolitical Tensions Flare: BTC/USD Dips Following Iran’s Rejection of Ceasefire


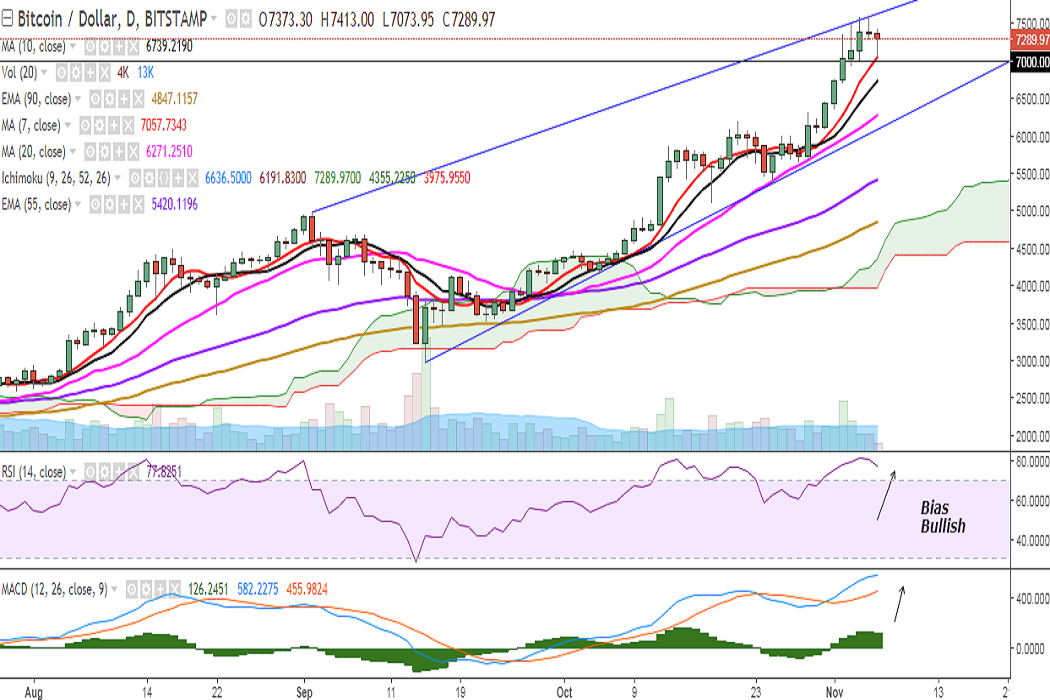
BTC/USD climbed to a fresh all-time high at $7590 levels on November 05, 2017. It is currently trading at 7323 levels at the time of writing (Bitstamp).
Ichimoku analysis of daily chart:
Tenkan Sen: 6636.50
Kijun Sen: 6191.83
On the upside, the pair is likely to face some resistance at 7423 (1h 20-SMA) and a break above would see it testing 7535 levels (Upper Bollinger)/7590 (November 05 high). Further strength would see it testing 7627 (trend line joining 4979.90 and 7590)/7660 (1h upper Bollinger)/7700.
On the reverse side, the pair has found support near 7057 (7-DMA) and any violation would drag it to 7000/6740 (10-DMA). Further weakness would see it testing 6500 (23.6% retracement of 2972.01 and 7590)/6272 (20-DMA).
Momentum studies: Bias remains bullish on the daily chart with no signs of reversal. RSI strong at 78, MACD line is above the signal line, and major moving averages biased higher. However, caution is advised as stochs are in the overbought zone.
Some bearishness could be seen on the intraday charts. On the 2H chart, MACD line is below the signal line and RSI is at 46.
A break below 7057 levels would see minor bearishness in the pair.
FxWirePro launches Absolute Return Managed Program. For more details, visit http://www.fxwirepro.com/invest

- News

- Economy

- Central Banks
- Investing
- Research
- Roundups
- Digital Currency
- Insights
- Technical Analysis
- Technology
- Business
- Law
- Health
- Nature
- Fintech
- Science
- Topic
- Opinions
- ©Econometrics LLC . All Rights Reserved.
FxWirePro: BTC/USD finds strong support at 7-DMA, break below to see minor bearishness
Monday, November 6, 2017 7:09 AM UTC
Editor's Picks


- Market Data
Most Popular


