


 FxWirePro: Daily Commodity Tracker - 21st March, 2022


 - EconoTimes)


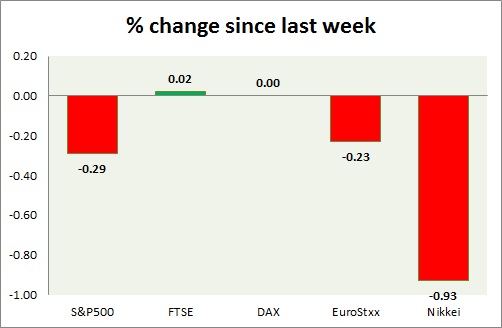
Equities are all mixed in today’s trading. Kindly note all instruments mentioned here are CFDs, whose values might differ from cash or future traded. Performance this week at a glance in chart & table -
S&P 500 –
- S&P 500, is down as Doha talks failed to secure agreement over oil freeze, fuelling risk aversion. Today’s range 2081-2064
- S&P 500 future is currently trading at 2075. Immediate resistance lies at 2100 and support at 2060, 2020.
FTSE –
- FTSE recovered from earlier loss and now up marginally for the day. Today’s range 6340-6260
- FTSE is currently trading at 6330. Immediate support lies at 5800, 5500 and resistance 6350, 6820.
DAX –
- DAX is still down but recovered most of its earlier loss. Today’s range 10070-9900
- DAX is currently trading at 10040. Immediate support lies at, 9100, 9500 area and resistance at 10350 around.
EuroStxx50 –
- Stocks across Europe are mixed today.
- German DAX is down (-0.04%), France’s CAC40 is down (-0.1%), Italy’s FTSE MIB is up (+0.1%), Spain’s IBEX is down (-0.45%).
- EuroStxx50 is currently trading at 3040, down by -0.15% today. Support lies at 2750 and resistance at 3150.
Nikkei –
- Nikkei worst performer today as massive quake of 7.3 magnitude devastated southern Japan. Today’s range 16610-16240
- Nikkei is currently trading at 16450. Immediate support lies at 15500, 16000 and resistance at 167000.
|
S&P500 |
-0.29% |
|
FTSE |
+0.02% |
|
DAX |
+0.00% |
|
EuroStxx50 |
-0.23% |
|
Nikkei |
-0.93% |


