


 Bitcoin Battles Volatility: Institutional Support Eyes USD 64,000 Floor Amid Geopolitical Tensions
  Ethereum Reclaims Higher Ground: Ether Bulls Target $2,700 as Middle East Tensions Thaw
  FxWirePro: GBP/USD stuck in range but maintains bearish bias
  FxWirePro: USD/ZAR continues to recovers , upside pressure builds
  FxWirePro- Major Crypto levels and bias summary
  The four types of dementia most people don’t know exist
  Bitcoin's Tug-of-War: Bulls Eye 80,000 USD Despite Turbulent ETF Outflows


The year-2018 has been bearish rout for bitcoin price, during that phase, BTC price showed steep slumps and year-2019 has been mixed bag of sentiments, we could see no traces of slowing in its dominance as 2019.
At the beginning of the year, BTCUSD price surged from the lows of $3,122 to the recent highs of $13,880 levels (i.e. mammoth returns of 344 in percentage terms that too within a span of 6 months or so, refer 1stchart).
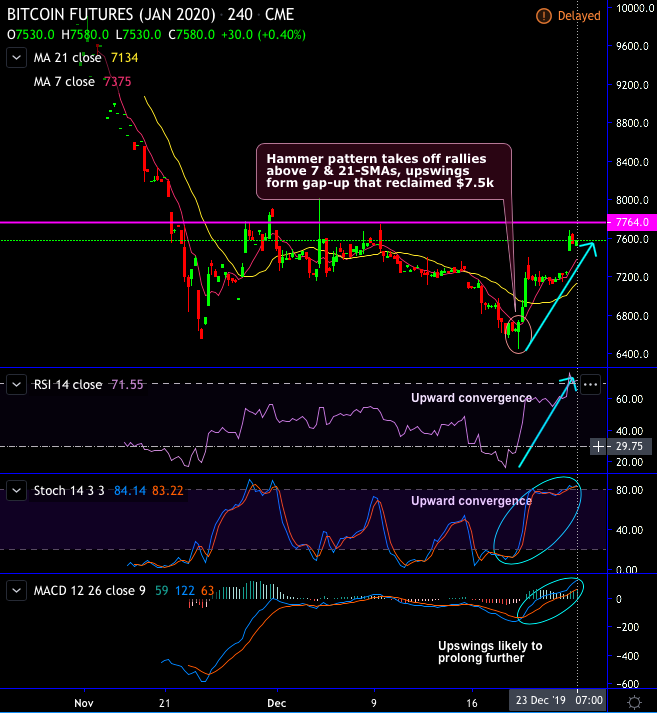
Although Year-2019 has been instrumental for bitcoin exchanges, crypto-traders and investors, it has been little turbulent. However, such robust uptrend has generated various price gaps in the CME Bitcoin futures contracts (refer 1st chart). Hammer pattern takes off rallies above 7 & 21-SMAs, the upswings form gap-up that reclaimed $7.5k.
Technically, Shooting star plummets prices below EMAs, both leading oscillators in tandem with price slumps in intermediate trend of BTCUSD, the underlying price has retraced 61.8% Fibonacci levels that has wiped off most of the gains in the year-2019. Whereas the slumps have halted at that juncture and showing some strong supports. As a result, hammer pattern occurred at $7,509 levels to counter.
We could see the stiff resistance levels at $7,764 levels, if bulls manage to breakout these levels decisively, then we could foresee more upside traction easily upto $8.5k levels. Thus, we add fresh longs at spot level for targets upto $8.5k levels with strict stop loss of $7,085 levels.


