


 Despite its best efforts, Iran won’t be able to toll the Strait of Hormuz. Here’s why
  The government is ‘doubling down’ on its social media ban. But bigger penalties for platforms aren’t enough
  Silver Cracks Key 365-Day EMA for First Time Since Feb 2024; Bears Eye $50 on Rallies
  Gold's 365-Day EMA Streak Since Oct 2023 Faces Its First Real Test at $3,980 — Break or Bounce to $4,140?
  A Korean Family Spent 34 Years Hoarding Chinese Tea. Now They're Putting It on the Blockchain.
  Part II — The listing: NFTs as bottle-stamps, and a vault the family is in no rush to sell
  Sell the Bounce": Gold Rally Stalls Near $4165 as Fed Hawks Slam the Door on Rate Cuts — Targets $4000/$3600
  Gold Surges Above Key EMAs, Bulls Eye Resistance Amidst Bullish Momentum
  Europe Heatwave Creates Growth Opportunity for Carrier, Trane, and Johnson Controls, Citi Says
  Morgan Stanley Sees Chinese Auto Market Recovery Gaining Momentum in Late Summer
  Open-Source AI Models Gain Ground as Enterprises Seek Lower-Cost Alternatives, Citi Says


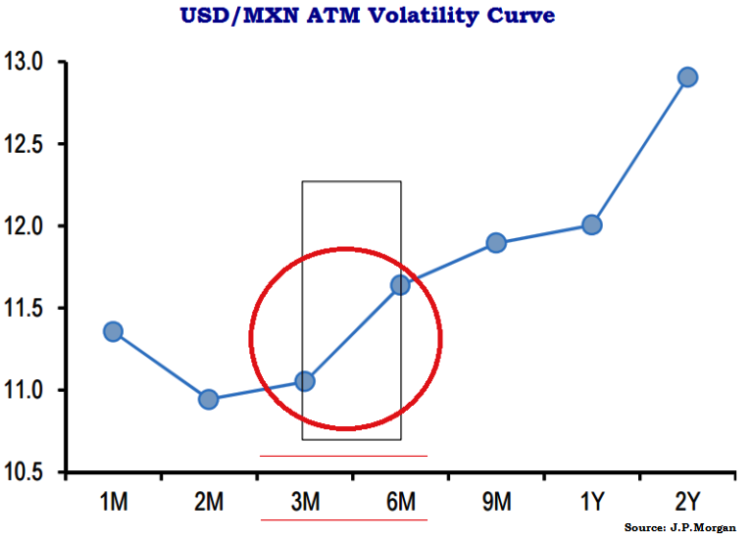
As shown in the figure, volatility curve for USD/MXN pair is steeply upward between 3M-6M segment, relatively stagnant between 6m-1Y and steep spike again beyond 1Y segment.
Since the 3M-6M sector of the USD/MXN vol curve is steep enough and implied volatilities are historically eminent enough despite their substantial decline this month such that 3M FVAs look reasonable sells.
Our slightly bearish inclination on the peso in Q2 leads the forecast at 15.35-25 levels, but spot in a 15.17-15.38 range still looks around fair versus coincidental risk metrics.
FVAs are the right instrument to sell MXN vol with rather than straight straddles since realized volatilities are still clocking at or above IV, so vol carry in the former is flat-to slightly negative.
If this were to change as the drag both delivered and implied vol lower, FVA shorts would benefit too from the Vega re-mark in addition to curve slide.
We pair a MXN FVA short with a NOK FVA in part due to a shared dependency on commodity price fluctuations, but mostly because NOK as high-beta proxy for EUR can hedge away some of the systemic risk of outright MXN shorts without any carry penalty.

- News

- Economy

- Central Banks
- Investing
- Research
- Roundups
- Digital Currency
- Insights
- Technical Analysis
- Technology
- Business
- Law
- Health
- Nature
- Fintech
- Science
- Topic
- Opinions
- ©Econometrics LLC . All Rights Reserved.
Short MXN volatility through USD/NOK – USD/MXN 3M3M FVA spreads
Friday, June 5, 2015 7:30 AM UTC
Editor's Picks


- Market Data
Most Popular


