


 Europe can’t achieve space sovereignty alone. Here’s why
  Big AI wants to slow down AI research. Is it a safety pause or a strategic retreat?
  AI is supercharging money scams – here’s what you can do to protect yourself
  FxWirePro- Crypto Weekly Alpha: ETF Rebounds, L2 Rallies & Key Resistance Levels
  Banking scandal rocks Brazil’s politics and the country’s presidential election in October
  FxWirePro- Crypto Weekly Alpha: ETF Rebounds, L2 Rallies & Key Resistance Levels
  China’s robots can run faster than Usain Bolt – now they are being prepared for war
  fnny Beta Launches With a Simple Idea: Find an Event, Show Up, Get Rewarded
  Synthetic data could ease people’s concerns about privacy breaches. But who gets to create it?


 Add as a preferred source on Google
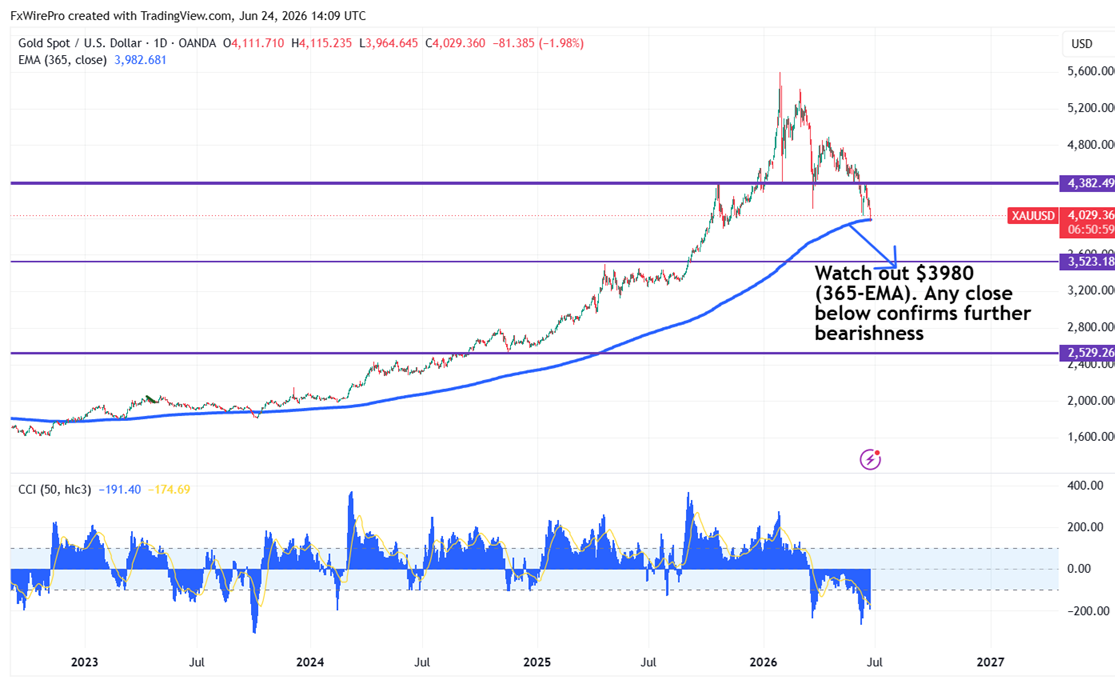
Since October 17, 2023, gold has had a consistent price over its 365-day EMA; that support level is currently close to $3,980, the most important line in the sand for the present structure. A definitive daily close under $3,980 would indicate a historic break of this moving average and signal more bearish continuation, therefore exposing downward objectives at $3,886, $3,800, and $3,718 in sequence. For high-risk traders looking to try a countertrend long, the setup provides a tight entry with a stop close to $4,000 and a hard stop-loss set just under today's low of around $3,960, targeting a recovery between $4,140 and $4,145 should buyers effectively reclaim and hold the broken support zone.

- News

- Economy

- Central Banks
- Investing
- Research
- Roundups
- Digital Currency
- Insights
- Technical Analysis
- Technology
- Business
- Law
- Health
- Nature
- Fintech
- Science
- Topic
- Opinions
- ©Econometrics LLC . All Rights Reserved.
Gold's 365-Day EMA Streak Since Oct 2023 Faces Its First Real Test at $3,980 — Break or Bounce to $4,140?
Wednesday, June 24, 2026 2:09 PM UTC
Editor's Picks



- Market Data
Most Popular




