


 FxWirePro: AUD/USD dips after RBA Governor speech
  EUR/USD Bounces from Monthly Low, But Bearish Pressure Remains
  FxWirePro: NZD/USD edges lower, remains on back foot
  FxWirePro: EUR/NZD up trend gains momentum but hurdles ahead
  NZDJPY Pullback: Sell Rallies Toward 93.30 as Yen Weakness Eases
  AUDJPY Weakness Deepens: Sell Rallies Toward 112 as Aussie Dollar Falters
  FxWirePro- Major Crypto levels and bias summary
  FxWirePro: GBP/NZD gains some ground but bias is still bearish
  FxWirePro- Woodies pivot (Major)
  FxWirePro: GBP/AUD downside pressure builds, key support level in focus
  JPY Action Bias: USDJPY Emerges as the Clear Bullish Pair to Watch Amid Mixed Crosses
  FxWirePro- Major Pair levels and bias summary
  FxWirePro: GBP/AUD gains some upside momentum but still bearish
  FxWirePro : USD/JPY holds relatively bid on 163 ahead Of FOMC,BoJ meetings


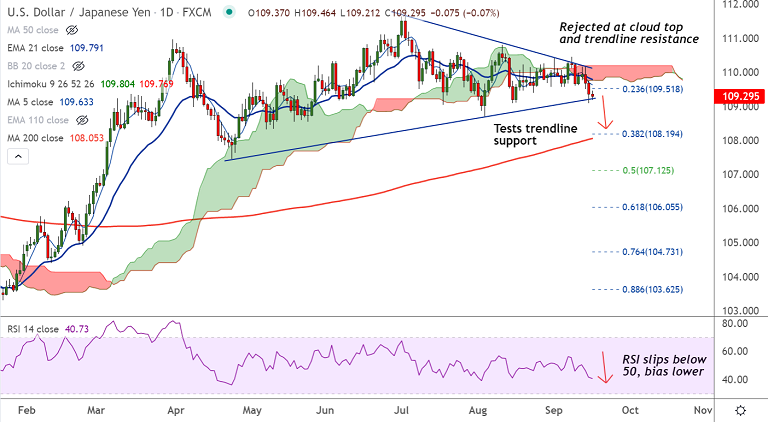
USD/JPY chart - Trading View
Spot Analysis:
USD/JPY was trading 0.05% lower on the day at 109.31 at around 06:30 GMT
Previous Week's High/ Low: 110.44/ 109.58
Previous Session's High/ Low: 109.74/ 109.11
Fundamental Overview:
U.S. data overnight showed core inflation missed estimates and import prices surprisingly dropped in August.
FOMC meeting looms next week. Traders await further clues on when the central bank will begin asset tapering.
Focus now on Thursday is on Retail Sales, which are projected to have dropped in August for the second consecutive month.
The Philly Fed Manufacturing index is also of interest after the NY Fed Manufacturing index earlier this week beat estimates. Weekly jobless claims are set to bounce off the lows.
On the other side, the Japanese Yen gains on the optimism after a Reuters poll showed 53% of Japanese firms expected the economy would recover to pre-pandemic levels by end of the FY 2022.
Technical Analysis:
- USD/JPY was trading at 'Symmetric Triangle' base, break below will add to the downside bias
- The major was in the red for the third consecutive session
- Price action has slipped below 21-EMA on the weekly charts, close below will reinforce weakness
- GMMA indicator shows bearish shift on the daily charts, while major trend remains neutral
Major Support and Resistance Levels:
Support - 109.22 (Symmetric Triangle base), Resistance - 109.79 (21-EMA)
Summary: USD/JPY was trading pivotal at trendline support. Technical bias is bearish. Watch out for break below Symmetric Triangle pattern for further weakness.


