


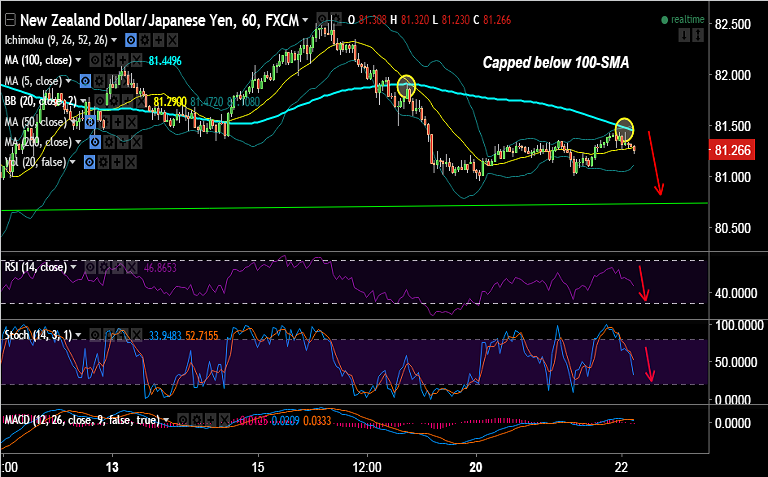
- NZD/JPY capped below 1H 100-SMA currently at 81.43, intraday bias lower.
- Techs on daily charts are biased lower, pair has slipped below 5-DMA.
- NZD/JPY weekly charts show weakness for the pair upto weekly 20-SMA at 79.66.
- We had identified a potential 'Bearish Gartley' pattern on NZD/JPY 4-hourly charts which builds downside scope.
Support levels - 80.70 (Trendline), 80, 79.66 (Weekly 20-SMA), 79.38 (100-DMA), 78.71 (cloud base)
Resistance levels - 81.34 (5-DMA), 81.70 (50-DMA), 81.94 (Weekly 5-SMA), 81.97 (20-DMA), 82.30 (Falling trendline)
TIME TREND INDEX OB/OS INDEX
1H Neutral Neutral
4H Bearish Neutral
1D Bearish Neutral
1W Bearish Neutral
Call update: We had advised a short in our previous call (http://www.econotimes.com/FxWirePro-NZD-JPY-breaks-below-50-DMA-good-to-go-short-on-rallies-547581).
Recommendation: Hold for targets.
FxWirePro Currency Strength Index: FxWirePro's Hourly NZD Spot Index was at -132.107(Highly Bearish), while Hourly JPY Spot Index was at 52.1828 (Slightly bullish) at 0650 GMT. For more details on FxWirePro's Currency Strength Index, visit http://www.fxwirepro.com/currencyindex.


