


 FxWirePro : USD/CAD falls as strong Canadian jobs data lifts loonie
  FxWirePro- Woodies pivot (Major)
  FxWirePro- Major Crypto levels and bias summary
  FxWirePro: GBP/USD eases as dollar firms ahead of U.S. June non-farm payrolls report
  FxWirePro- Woodies pivot (Major)
  EUR/USD Rockets Past 1.1560 as Soft U.S. Jobs Data Fuel Fed Rate-Cut Surge
  FxWirePro: GBP/AUD eases slightly, focus on near-term support
  FxWirePro: USD/CNY slips as strong China exports data Lift yuan
  FxWirePro: EUR/ AUD neutral in the near term, scope further downside
  FxWirePro- Major Crypto levels and bias summary
  FxWirePro: GBP/AUD under pressure after disappointing U.S. employment data
  FxWirePro- Major Pair levels and bias summary
  FxWirePro- Major Pair levels and bias summary
  FxWirePro: USD/ZAR gains some ground, but downtrend remains
  EURGBP Bears Break Trendline: Sell Rallies at 0.8578 as Support Breach Eyes 0.8450 Slide


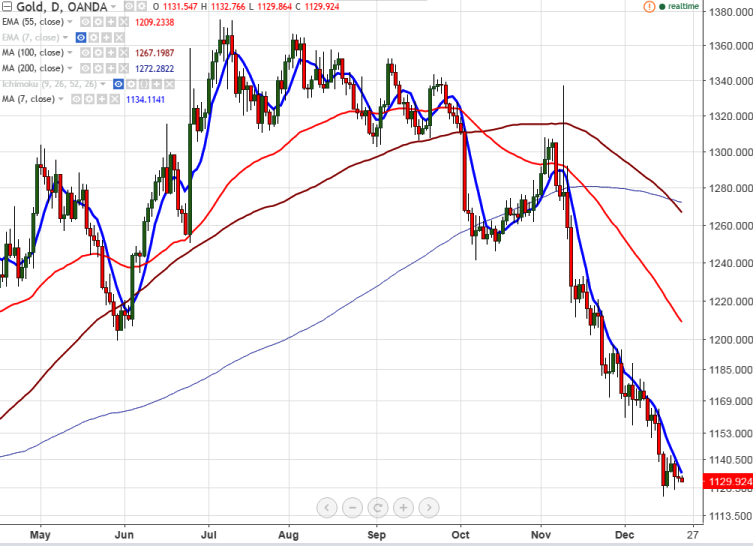
- Gold is trading in narrow range between $1122 and $1142 for the past three trading session. The yellow metal slightly recovered from fresh ten month low and is currently trading around $1130.
- Gold has shown a slight jump from the low of $1125 but upside will capped by 7- day MA due to dollar strength and equity market outperformance.
- Technically Gold is facing minor resistance at $1142 (7- day MA) and any break above will take the pair till $1149 (10- day MA)/$1167 (21- day MA). The yellow metal should close above 21- day MA ($1167) for further jump till $1188 (Dec 4th 2016 high)/$1197.
- On the lower side any close below $1116 (78.6% retracement of $1046 and $1375) and any violation below will drag the pair down till $1100/$1085.
It is good to sell on rallies around $1140-42 with SL around $1150 for the TP of $1116/$1090.







