


 Wall Street Analysts Weigh in on Latest NFP Data
  Fed May Resume Rate Hikes: BofA Analysts Outline Key Scenarios
  FxWirePro: NZD/USD downside pressure builds, key support level in focus
  AUDJPY Breaks Key Trendline Support — Bears Eye 110 as Momentum Accelerates
  FxWirePro- Major Crypto levels and bias summary
  FxWirePro: GBP/USD slides toward critical support market reassesses UK political transition
  Goldman Predicts 50% Odds of 10% U.S. Tariff on Copper by Q1 Close
  FxWirePro: USD/ZAR remains buoyant, looks to extend gains
  ETH Bounces as Shorts Cover, Yet ETF Bleed Warns $1,850 Resistance Won’t Break
  FxWirePro: GBP/NZD gaining momentum for a move towards 2.3350level
  Indonesia Surprises Markets with Interest Rate Cut Amid Currency Pressure
  FxWirePro: USD/CAD hits 14-month high , Scope for further upside
  U.S. Treasury Yields Expected to Decline Amid Cooling Economic Pressures
  Moldova Criticizes Russia Amid Transdniestria Energy Crisis
  Sterling Slump Sends GBPJPY Toward 212.60 — Bearish EMA Stack Eyes 210
  Urban studies: Doing research when every city is different


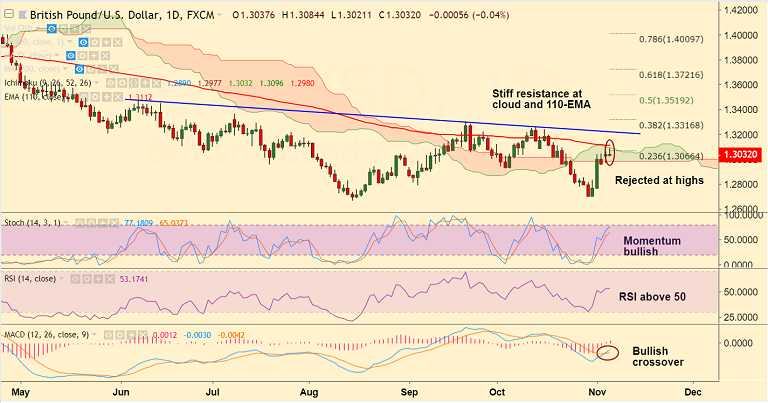
GBP/USD chart on Trading View used for analysis
- GBP/USD slips lower from fresh 2-week highs at 1.3085, trades 0.08% lower at 1.3027 at the time of writing.
- UK trade secretary Liam Fox, said that there are still a number of Brexit issues that need to be dealt with and it is impossible to say if Brexit deal can be reached this month or next.
- Focus now on May's meeting with Cabinet ministers, headlines coming out will influence the GBP price action.
- Technical studies are neutral to slightly bullish. Stochs and RSI support upside. We also see a bullish MACD line crossover on signal line.
- The major finds stiff resistance at daily cloud and 110-EMA. Break above could see further upside.
- On the flipside, retrace below daily cloud will see weakness. Drag till lower Bollinger Band at 1.2691 likely.
Support levels - 1.2960 (nearly converged 5-DMA and 21-EMA), 1.2695 (Oct 30 low)
Resistance levels - 1.3112 (110-EMA), 1.3215 (trendline), 1.3316 (38.2% Fib)
For details on FxWirePro's Currency Strength Index, visit http://www.fxwirepro.com/currencyindex.


