


 NZD/JPY Loses Its Shine: Kiwi Cracks Under Pressure as Bears Target 91.80
  Gold Prices Fall Amid Rate Jitters; Copper Steady as China Stimulus Eyed
  Lithium Market Poised for Recovery Amid Supply Cuts and Rising Demand
  FxWirePro: GBP/USD slides toward critical support market reassesses UK political transition
  S&P 500 Relies on Tech for Growth in Q4 2024, Says Barclays
  FxWirePro: AUD/USD eases after Australian mixed CPI data
  Peace Dividend Powers NZDJPY Past 93.50 — Bulls Set Sights on 96.15 Target
  Indonesia Surprises Markets with Interest Rate Cut Amid Currency Pressure
  Energy Sector Outlook 2025: AI's Role and Market Dynamics
  FxWirePro: EUR/AUD bullish outlook with scope to target 1.6500
  US Gas Market Poised for Supercycle: Bernstein Analysts
  FxWirePro- Major Pair levels and bias summary
  FxWirePro: AUD/USD climbs as US-Iran peace deal sparks risk rally
  Fed May Resume Rate Hikes: BofA Analysts Outline Key Scenarios
  FxWirePro: NZD/USD jumps after US and Iran agree preliminary deal


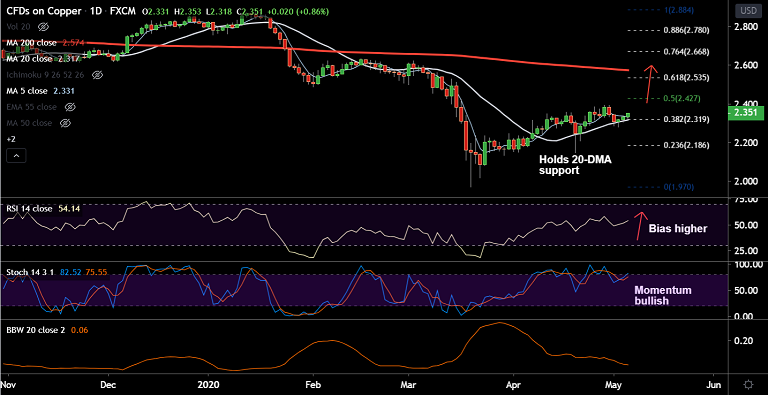
Copper chart - Trading View
Copper was trading 1.25% higher on the day at 2.359 at around 11:30 GMT.
Price is extending upside for the 3rd straight session, bias is turning bullish.
The pair is extending upside in a 'Rising Channel' pattern and has bounced off 20-DMA support.
Technical indicators are supporting gains. RSI is above 50 and biased higher. Momentum with the bulls.
The pair has broken above 50-DMA and is testing 55-EMA resistance. Price action is above 200H MA.
Volatility is rising on the intraday charts, scope for further upside. 55-EMA is immediate resistance at 2.370.
Next major hurdle above 55-EMA aligns at 50% Fib at 2.427 ahead of channel top at 2.480.
20-DMA is strong support at 2.318. Break below will negate any bullish bias.


