


 FxWirePro- Major Crypto levels and bias summary
  FxWirePro- Major Crypto levels and bias summary
  World Cup technology: from ref cams to AI analysts, cutting-edge research is changing the game
  BTC Slips Below $60K as Institutional Demand Dries Up — Bears Eye $59K Support, Rallies to $63K for Shorts


In the week preceding June 18, 2025, U.S. spot Bitcoin ETFs exhibited notable momentum, registering eight consecutive days of positive inflows. June 18 stood out in particular, with net inflows reaching approximately $388 million. BlackRock’s iShares Bitcoin Trust (IBIT) dominated this trend, attracting roughly $279 million, while Fidelity’s Wise Origin Bitcoin Fund (FBTC) and Bitwise Bitcoin ETF (BITB) followed with inflows of $104 million and $11 million, respectively. In contrast, Grayscale’s GBTC and Mini Trust products recorded net outflows, suggesting a discernible shift in investor preference toward other ETF offerings. The persistent influx of capital into spot Bitcoin ETFs reflects sustained institutional interest in Bitcoin, even in the context of ongoing geopolitical instability in the Middle East.
Simultaneously, large-scale Bitcoin holders—often referred to as “whales”—have continued to support the market price through active accumulation during periods of heightened uncertainty. This strategic behavior has contributed to maintaining Bitcoin’s price stability within the $104,000 to $105,000 range. Data indicates that these investors frequently capitalize on market downturns triggered by geopolitical shocks, as evidenced by their activity during recent Israel-Iran tensions. Collectively, the ongoing inflows to Bitcoin ETFs and the accumulation by large holders underscore a prevailing confidence in Bitcoin’s value proposition, notwithstanding broader macroeconomic and geopolitical challenges.
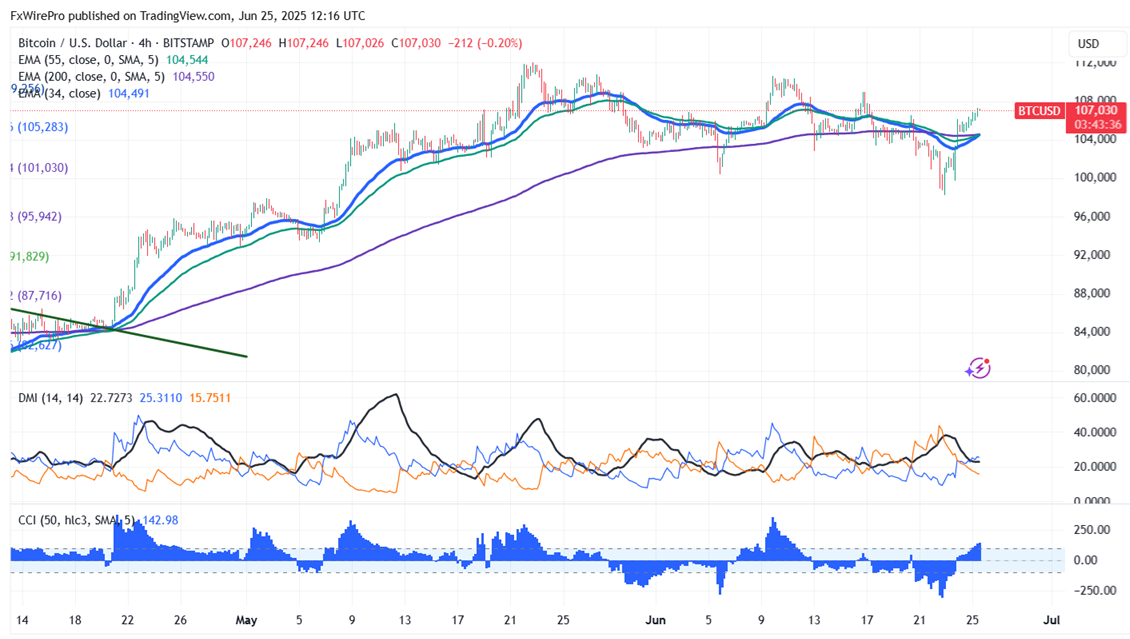
Technical Analysis: Key Levels to Watch for BTC/USD
BTC/USD gained momentum after ceasefire agreement between Iran and Israel.It trades above both short-term (34-EMA and 55-EMA) and below long-term (200-EMA) moving averages on the daily chart. Minor support is around $103000; breaking below this would drag the pair down to $10000/$94660/$90000. Immediate resistance is around $110,000 indicates that closing above this level could lead to targets at $111,292, $115,000, or even $135,000.
Investment Strategy: Opportunities for Traders
Indicators (4-hour chart).
CCI(500- Bullish
Directional movement index - Bullish
It is good to buy on dips around $103000 with a stop-loss set at $98000 for a TP of $135000.


