


 Goldman Sachs: US Dollar Likely to Stay Strong Despite Oil Price Retreat
  SpaceX Stock Gets $175 Target as Analysts See Massive Growth Ahead
  World Cup technology: from ref cams to AI analysts, cutting-edge research is changing the game
  With Iran and the US signing a peace deal, where does that leave Benjamin Netanyahu?
  Today’s space race could turn fatal if we don’t agree on new rules
  China’s AI Manufacturing Boom Masks Weak Consumer Economy, Citi Says
  How Donald Trump has changed the way diplomacy is done
  Gold's 365-Day EMA Streak Since Oct 2023 Faces Its First Real Test at $3,980 — Break or Bounce to $4,140?
  How AI prompting turned writerly description into an everyday skill


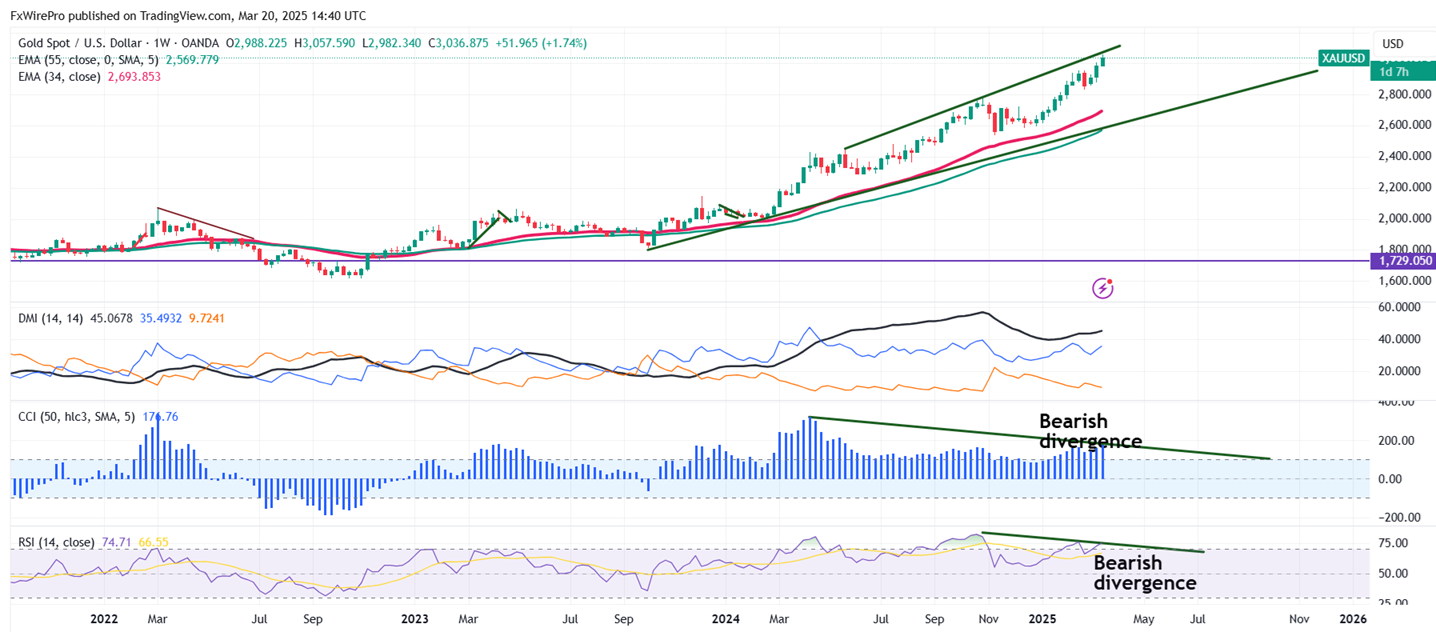
Bearish divergence (RSI and CCI (50)- Daily and weekly chart
Gold hits an all-time high at $3057 and surged more than 15% this year as geopolitical tension increases demand for safe-haven assets. It is currently trading at around $3035.
Rate Pause Expectations Rise
According to the CME Fed Watch tool, the chances of a rate pause in the May 19th, 2025 meeting have increased to 85% from 65.20% a week ago.
Technical Analysis: Key Levels and Trading Strategy
Gold prices are holding above short-term moving averages of 34 EMA and 55 EMA and abovethe long-term moving averages (200 EMA) in the weekly chart. Immediate support is at $3020 and a break below this level will drag the yellow metal to $2985/$2956/$2920/$2900/$2880. The near-term resistance is at $3080 (trend line joining $2450 and $2790) with potential price targets at $3100.
Indicators -
RSI (14)- 72.49 (oversold)
It is good to sell on rallies around $3048-50 with a stop-loss at $3080 for a target price of $2835.


