


 Ethereum’s $2,200 Ceiling: Can Diplomatic Breakthroughs Dissolve the Bearish Resistance?
  FxWirePro- Major Crypto levels and bias summary
  FxWirePro- Major Crypto levels and bias summary
  Ethereum Retreats in Bitcoin’s Shadow: ETH/USD Tests Critical Support at USD 2,075
  FxWirePro- Major Crypto levels and bias summary


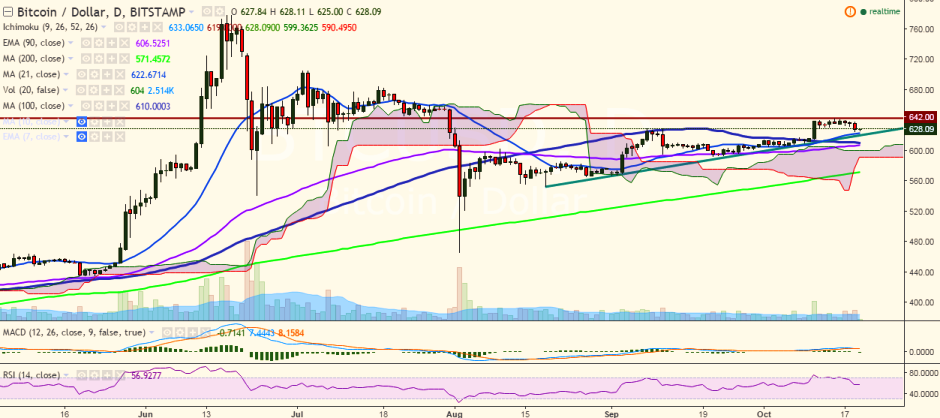
BTC/USD fell to 624.13 on Wednesday before closing at 627.98 levels, where it trades currently (Bitstamp).
Long-term trend: Bullish
Ichimoku analysis of daily chart:
Tenkan Sen: 628.28
Kijun Sen: 619
Trend reversal: 606.04 (90 EMA)
“21-day MA is acting as a major support for the pair. The short-term trend appears bullish for the pair and it is unlikely to break below the trend line joining 552.30 and 567.03”, FxWirePro said in a statement.
On the upside, major resistance is seen at 642 levels (October 15 high) and any violation would target 648.12 levels (161.8% retracement of 642 and 632.10)/684.19 (July 17 high).
On the downside, support is seen at near 621.60 (21-day MA) and a consistent break below would see the pair falling to 606.04 (90 EMA)/592 (September 21 low).

- News

- Economy

- Central Banks
- Investing
- Research
- Roundups
- Digital Currency
- Insights
- Technical Analysis
- Technology
- Business
- Law
- Health
- Nature
- Fintech
- Science
- Topic
- Opinions
- ©Econometrics LLC . All Rights Reserved.
FxWirePro: BTC/USD takes support near 21-DMA, good to buy on dips
Thursday, October 20, 2016 7:31 AM UTC
Editor's Picks


- Market Data
Most Popular


