


 Ethereum Retreats in Bitcoin’s Shadow: ETH/USD Tests Critical Support at USD 2,075
  FxWirePro- Major Crypto levels and bias summary
  FxWirePro- Major Crypto levels and bias summary
  Ethereum’s $2,200 Ceiling: Can Diplomatic Breakthroughs Dissolve the Bearish Resistance?
  FxWirePro- Major Crypto levels and bias summary


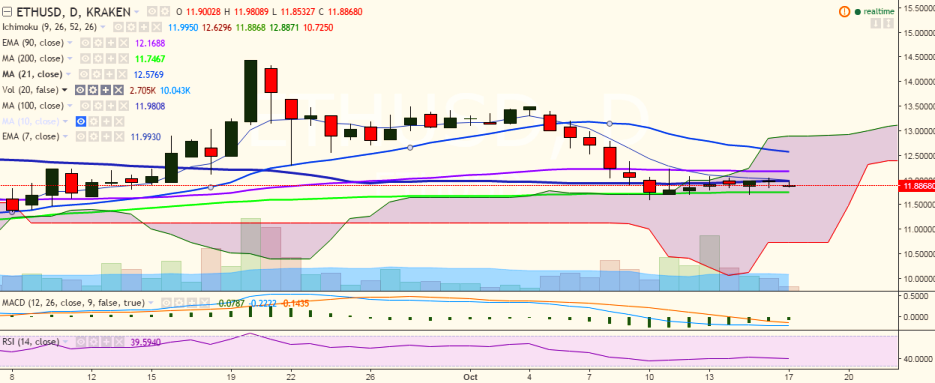
ETH/USD has been trading in a narrow range for the past couple of days and is struggling for a consistent break above 12.00 levels. It is currently trading at 11.88 levels (Kraken).
Ichimoku analysis of daily chart:
Tenkan Sen: 12.20
Kijun Sen: 12.96
Trend reversal: 12.17 (90 EMA)
The pair faces major resistance at 11.97 levels (100-day MA) and it must close above for further upside, Bullishness in the pair could be confirmed only if it breaks above 12.17 levels (90 EMA), which would see it testing 12.62 (21-DMA).
On the downside, support is seen at 11.74 (200-DMA) and a break below would target 11.60 levels (October 10 low)/11.35 (September 08 low).

- News

- Economy

- Central Banks
- Investing
- Research
- Roundups
- Digital Currency
- Insights
- Technical Analysis
- Technology
- Business
- Law
- Health
- Nature
- Fintech
- Science
- Topic
- Opinions
- ©Econometrics LLC . All Rights Reserved.
ETH/USD faces strong resistance at 12.00, break above targets 12.62
Monday, October 17, 2016 11:34 AM UTC
Editor's Picks


- Market Data
Most Popular


