


 FxWirePro- Major Crypto levels and bias summary
  Ethereum Trails Bitcoin’s Retreat: Key Support Levels in Focus
  Bitcoin Retreats Toward Critical Support as Geopolitical Winds Shift
  Bitcoin Retreats as Geopolitical Tensions Flare: BTC/USD Dips Following Iran’s Rejection of Ceasefire
  FxWirePro- Major Crypto levels and bias summary
  Ethereum’s $2,200 Ceiling: Can Diplomatic Breakthroughs Dissolve the Bearish Resistance?
  FxWirePro- Major Crypto levels and bias summary


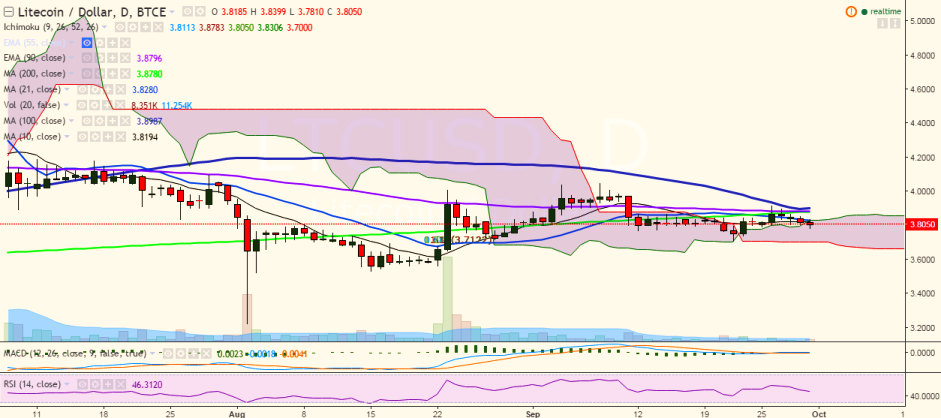
LTC/USD moved further south on Friday and has hit a fresh low of 3.78 levels. It is currently trading at 3.79 levels (BTC-e).
Short-term trend: Bearish
Ichimoku analysis of daily chart:
Tenkan Sen: 3.81
Kijun Sen: 3.87
Trend reversal: 3.88 (90 EMA)
“The pair is showing a dip after hitting 3.91 levels earlier this week and has moved inside the Ichimoku cloud once again. It is trading weak and is likely to find support near 3.75 levels”, FxWirePro said in a statement.
Major resistance is seen at 3.87 levels (200-DMA) and a break above would target 3.91 (September 26 high)/ 4.05 (September 08 high).
On the downside, support could be found at 3.75 (psychological levels) levels and any violation would see the pair falling to 3.70 (September 22 low)/3.50 (psychological level).

- News

- Economy

- Central Banks
- Investing
- Research
- Roundups
- Digital Currency
- Insights
- Technical Analysis
- Technology
- Business
- Law
- Health
- Nature
- Fintech
- Science
- Topic
- Opinions
- ©Econometrics LLC . All Rights Reserved.
LTC/USD continues downtrend, eyes 3.70
Friday, September 30, 2016 10:46 AM UTC
Editor's Picks


- Market Data
Most Popular


