


 Japan Signals Preference for Low Interest Rates as BOJ Policy Debate Intensifies
  South Korea Signals Possible Interest Rate Hike as Inflation Remains Elevated
  ECB Keeps July Rate Options Open Amid Iran War Energy Price Risks
  Bitcoin Tumbles Below $60,000 Amidst Persistent ETF Outflows
  RBA Minutes Signal Australia Central Bank Remains Ready to Raise Interest Rates if Inflation Persists
  Indonesia Plans Higher Asset Yields to Boost Rupiah and Restore Investor Confidence
  FxWirePro- Major Pair levels and bias summary
  FxWirePro: GBP/NZD sustains gains as uptrend remains strong
  FxWirePro USD/JPY eases slightly ahead Of US June jobs report
  FxWirePro: EUR/AUD bull’s hold the higher ground, remains on bullish path
  FxWirePro: USD/JPY consolidates gains, 163 eyed
  FxWirePro- Woodies pivot (Major)
  NZDJPY Bullish on Yen Weakness; Buy on Dips Strategy Recommended
  FxWirePro: NZD/USD recovers slightly but bearish outlook persist
  FxWirePro: GBP/AUD uptrend loses steam, remains on bullish path
  GBPJPY Surges on Yen Weakness; Bullish Trend Favors Dip Buying


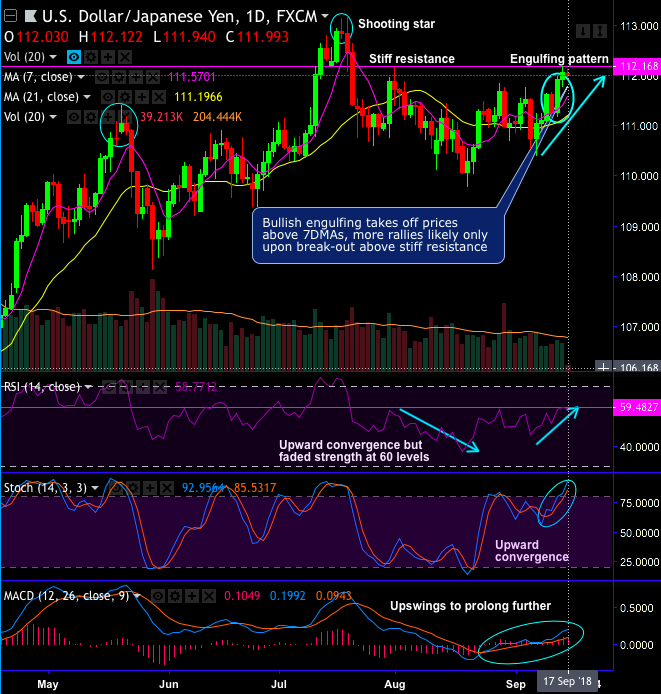
- The bullish engulfing pattern has occurred at 111.922 levels on daily plotting of USDJPY, consequently, the current price spikes above DMAs as the upswings extend further yesterday as well. But for today, stiff resistance is observed at 112.168 levels. More rallies likely only upon break-out above this resistance. Both leading oscillators show upward convergence but the faded strength is seen at 60 levels (see daily RSI curve). Both lagging indicators show bullish DMA & MACD crossovers that signal upswings to drag further.
- As BOJ’s monetary policy is scheduled for this week, FX market likely to nudge trade war tormentor for a while. While there is no sign of raising rates for a quite some time and the recent phases to shift policy more flexible are not targeted at placing the groundwork for an eventual exit from its massive stimulus.
- While the current intermediate trend is wedged between 115.624 and 104.629 levels (refer weekly charts).
- On this timeframe, bulls have retraced from the March 2018 bottom of 104.687 levels to the December 2016 highs (118.833), but currently, prices seem to be slightly edgy at around 50% Fibonacci levels (refer weekly plotting). Price action on this timeframe has been showing overbought momentum into the long-lasting range bounded trend.
- If 50% Fibonacci level and 7-EMA doesn’t act as the major support, then, we could foresee bullish invalidation on retrace below.
Trade tips: On trading perspectives, it is wise to bid one touch call options using strikes at 112.168 levels.
Alternatively, on hedging grounds, at spot reference: 112.003 levels, we advocate shorting futures contracts of mid-month tenorsahead of the Bank of Japan’ monetary policy that is expected to stand pat this week after widening the target band of 10-year bond yield to ±0.2% at the July meeting.
As the underlying spot FX likely to target southwards 109 levels in the medium-runwriters in a futures contract are expected to maintain margins in order to open and maintain a short futures position.
FxWirePro Currency Strength Index: FxWirePro's Hourly USD Spot Index was at 56 (which is bullish), while Hourly JPY Spot Index was at -95 (bearish) at 07:10 GMT.
For more details on FxWirePro's Currency Strength Index, visit below web-link:


