


 Nasdaq Proposes Fast-Track Rule to Accelerate Index Inclusion for Major New Listings
  US Futures Rise as Investors Eye Earnings, Inflation Data, and Wildfire Impacts
  Energy Sector Outlook 2025: AI's Role and Market Dynamics
  Moldova Criticizes Russia Amid Transdniestria Energy Crisis
  Gold Prices Fall Amid Rate Jitters; Copper Steady as China Stimulus Eyed
  Goldman Predicts 50% Odds of 10% U.S. Tariff on Copper by Q1 Close
  U.S. Banks Report Strong Q4 Profits Amid Investment Banking Surge
  2025 Market Outlook: Key January Events to Watch
  Indonesia Surprises Markets with Interest Rate Cut Amid Currency Pressure
  Elon Musk’s Empire: SpaceX, Tesla, and xAI Merger Talks Spark Investor Debate


The triangles between Loonie–Sterling–Aussie to weaken elevated CAD-correlations: It is noted that umpteen numbers of times over the previous few weeks that CAD-denominated implied correlations are high, and they continue to stay elevated even as recent realized corrs have begun to cool.
Positive inflation data created optimism amongst CAD investors on Friday, fueling hopes that inflation might return to the center of the BoC’s target corridor.
It is effectively monetized this displacement over the past few weeks by shorting GBPCAD vs AUDCAD correlations via triangles of vanilla options comprising of short GBP calls/CAD puts, short AUD puts/CAD calls and long GBP calls/AUD puts with carefully chosen strikes and notionals on the cross leg (GBPAUD).
GBPCAD and AUDCAD spot are -1.7% and +1.7% since our publication (so both short legs have drifted out of the money) and trailing day-on-day realized correlation has dropped 20% pts., yet implied corrs are virtually unmoved, which is as much a sign of the relative obscurity of the CAD-cross option market as investor focus on weightier macro issues.
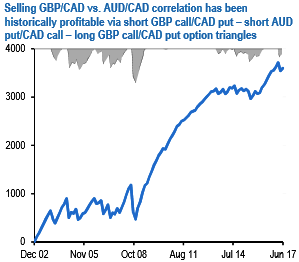
Cumulative returns (in bp CAD notional of the two CAD legs) from short GBP call/CAD put –short AUD put/CAD call –long GBP call/CAD put option triangles. Options are 2M in tenor, 30D strikes on the two CAD legs (notionals and strikes for the cross leg inferred from the notionals and strikes of the CAD legs) and rolled into fresh structures at expiry. All legs not delta-hedged. No transaction costs.
The genuine inefficiency that deserves waning, especially when the trade in question has a track record of high risk-adjusted returns (refer above chart), is net premium-earning at inception, and retains that intake in most states of the world within a +/-5% spot range over the life of the trade and with acceptable win-loss P/L ratios from net option selling structures (refer above table).
Having scalped most of the available P/L on our earlier recommendation, we roll it over into a fresh 2M clip this week.
Courtesy: JP Morgan


