


 Wall Street Analysts Weigh in on Latest NFP Data
  Trump’s "Shock and Awe" Agenda: Executive Orders from Day One
  Goldman Predicts 50% Odds of 10% U.S. Tariff on Copper by Q1 Close
  UBS Projects Mixed Market Outlook for 2025 Amid Trump Policy Uncertainty
  Bank of America Posts Strong Q4 2024 Results, Shares Rise
  Lithium Market Poised for Recovery Amid Supply Cuts and Rising Demand
  Energy Sector Outlook 2025: AI's Role and Market Dynamics
  Geopolitical Shocks That Could Reshape Financial Markets in 2025
  U.S. Treasury Yields Expected to Decline Amid Cooling Economic Pressures
  Indonesia Surprises Markets with Interest Rate Cut Amid Currency Pressure
  U.S. Banks Report Strong Q4 Profits Amid Investment Banking Surge
  Global Markets React to Strong U.S. Jobs Data and Rising Yields
  UBS Predicts Potential Fed Rate Cut Amid Strong US Economic Data


EURUSD skews seem to have turned towards calls, and that’s only the beginning. The option skew reflects the relative appetite for calls and puts, which only partly reflects pure directional expectations. The skew is primarily about volatility expectations conditional on a scenario on the spot.
Market makers actually trade the skew as per their perception of topside compared with downside volatility. To this end, we computed a realized skew that can be used like realized volatility. If we zoom in on the recent period, the EURUSD daily realized skew switched to positive territory in early March.
We daringly forecast in early June that the EURUSD skew might turn in favor of calls after a period of negative skew since autumn 2009. This is happening and is possibly the beginning of a new volatility regime.
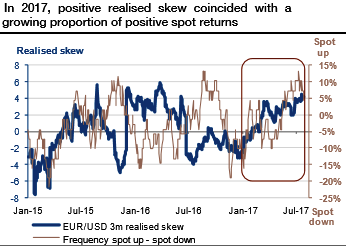
The Societe Generale metric for realized skew shows that it has become positive since EURUSD broke 1.08 (right after the first round of the French presidential election) and that the positive realized skew coincided with a growing proportion of positive spot returns.
An overshoot to 1.20 is still in sight for this summer; risk reversals should exhibit more bullishness.
The weak euro range of 2015-17 corresponded to the bulk of ECB asset purchasing, and, more universally, the period of negative skew since 2009 corresponded to global central bank accommodation. The ECB still has to clarify how the QE process will reverse, and the Fed must outline when balance sheet normalization will start. With these major communication steps still upcoming, the full bullish impact on the EURUSD skew has probably yet to be seen.
Hence, we advocate initiating longs in EURUSD 1y corridor volatility swap, range 1.17-1.20 Indicative offer: 6.9 (vs 8.1 for the standard volatility swap).
This product is similar to a standard volatility swap, except that volatility is taken into account only when the spot trades within a pre-defined range (the ‘corridor’). 1.17 is above the upper bound of the previous range, and 1.20 is the next psychological resistance.


