


 Bitcoin Retreats Toward Critical Support as Geopolitical Winds Shift
  Bitcoin Retreats as Geopolitical Tensions Flare: BTC/USD Dips Following Iran’s Rejection of Ceasefire
  Ethereum’s $2,200 Ceiling: Can Diplomatic Breakthroughs Dissolve the Bearish Resistance?
  FxWirePro- Major Crypto levels and bias summary
  Ethereum Trails Bitcoin’s Retreat: Key Support Levels in Focus
  FxWirePro- Major Crypto levels and bias summary
  Ethereum Retreats in Bitcoin’s Shadow: ETH/USD Tests Critical Support at USD 2,075
  BTCUSD Coils in Tight Range: Will Geopolitical Stability Trigger a Breakout Toward $80,000?


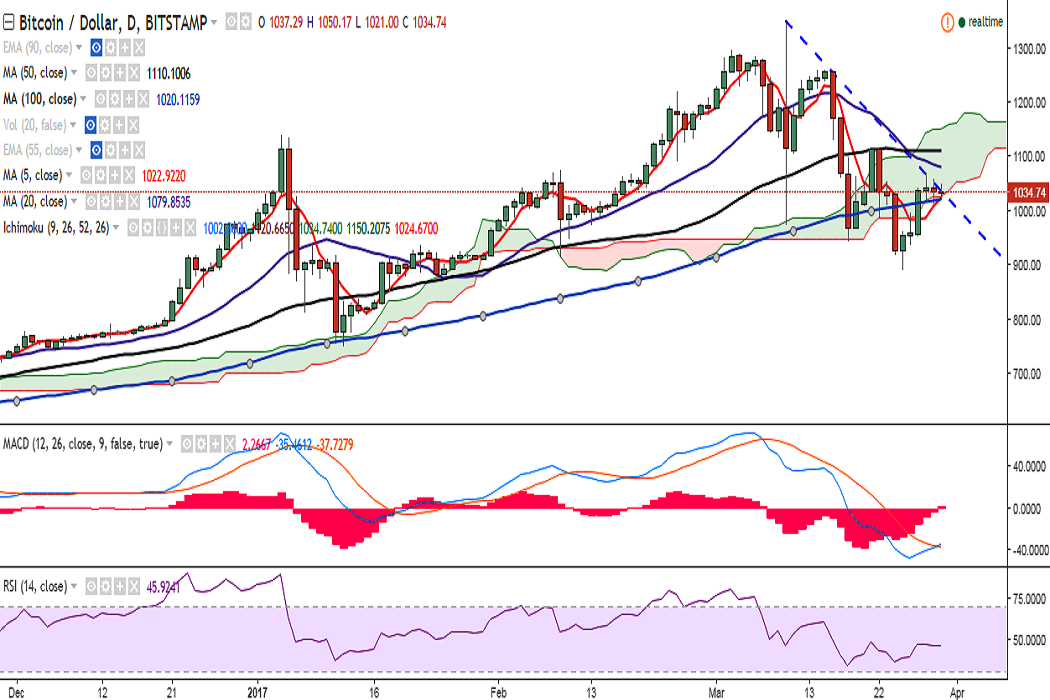
BTC/USD is trading in a narrow range on Thursday and trying to hold above 100-DMA. It is currently trading at 1044 levels at the time of writing (Bitstamp).
Ichimoku analysis of daily chart:
Tenkan Sen: 1002.86
Kijun Sen: 1120.66
Intraday bias appears neutral with spinning tops from last two days and a flat-lined RSI. The pair has found strong support near 1017 (100-DMA) and a break below could see further downside.
Overall bias appears bullish as long as 100-DMA support holds. Stochastics point higher and MACD seems to be on the verge of a bullish crossover.
The trend line joining 1350 and 1068.26 is acting as a major resistance for the pair and a consistent break above would see it testing 1068.26 (March 28 high)/1080.27 (20-DMA)/1110.26 (50-DMA)
On the downside, the pair has taken strong support near 1017 (100-DMA) and a break below would target 1000 (38.2% retracement of 891.33 and 1068.26)/979.80/944.36 (March 18 low).

- News

- Economy

- Central Banks
- Investing
- Research
- Roundups
- Digital Currency
- Insights
- Technical Analysis
- Technology
- Business
- Law
- Health
- Nature
- Fintech
- Science
- Topic
- Opinions
- ©Econometrics LLC . All Rights Reserved.
FxWirePro: BTC/USD finds strong support near 100-DMA, break below to see further downside
Thursday, March 30, 2017 8:32 AM UTC
Editor's Picks


- Market Data
Most Popular


