


 BTCUSD Coils in Tight Range: Will Geopolitical Stability Trigger a Breakout Toward $80,000?
  Bitcoin Retreats Toward Critical Support as Geopolitical Winds Shift
  Ethereum’s $2,200 Ceiling: Can Diplomatic Breakthroughs Dissolve the Bearish Resistance?
  Ethereum Retreats in Bitcoin’s Shadow: ETH/USD Tests Critical Support at USD 2,075
  Ethereum Trails Bitcoin’s Retreat: Key Support Levels in Focus
  FxWirePro- Major Crypto levels and bias summary
  FxWirePro- Major Crypto levels and bias summary
  Bitcoin Retreats as Geopolitical Tensions Flare: BTC/USD Dips Following Iran’s Rejection of Ceasefire


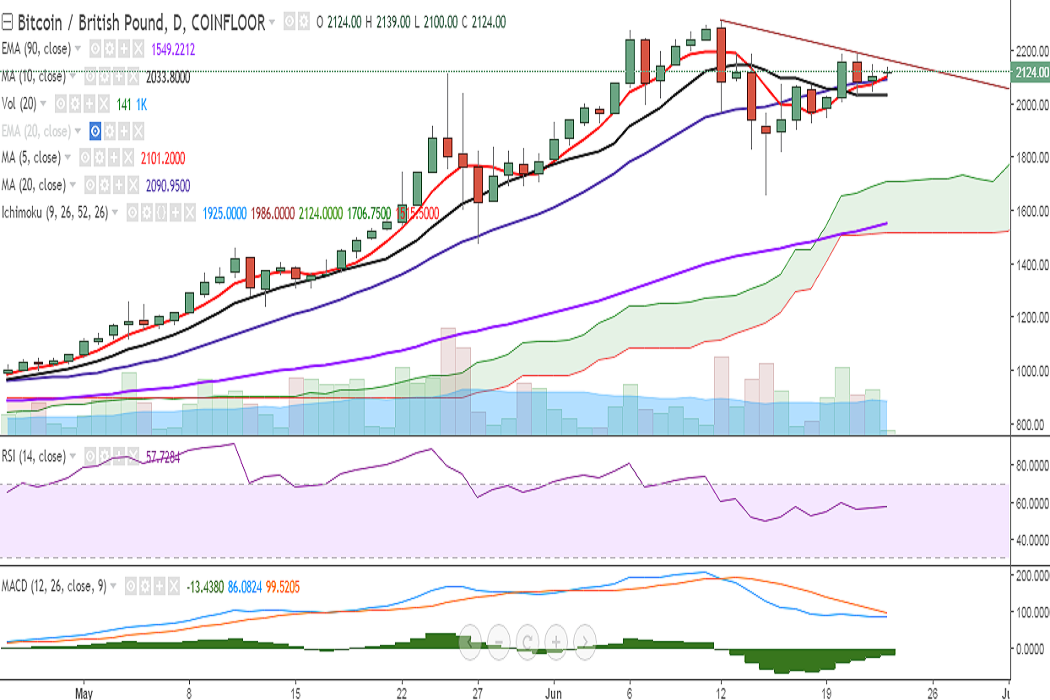
BTC/GBP continues to trade in a narrow range between 2100 and 2140 levels on Friday. It is currently trading at 2113 at the time of writing (Coinfloor).
Ichimoku analysis of daily chart:
Tenkan Sen: 1925
Kijun Sen: 1986
On the upside, the pair faces stiff resistance at 2165 (trend line joining 2315 and 2193) and a break above would see further bullishness, targeting 2200/ 2277 (June 06 high). Further strength would see it testing 2315 (June 12 high)/2400.
On the flipside, support is seen at 2090 (20-DMA) and a break below would target 2033 (10-DMA)/ 1970 (38.2% retracement of 1475 and 2277). Further weakness would drag it to 1876/ 1766 (50-DMA)/ 1657 (June 15 low).
Momentum studies: On the daily chart, RSI is holding at 57. The MACD line is below the signal line, however, the downward momentum appears to be fading. Also, 5- and 20-DMAs are biased higher. The narrowing of the Bollinger bands suggest an upcoming change in trend. A bullish MACD crossover coupled with a consistent break above the trend line resistance would confirm further bullishness in the pair.
On the 4-hour chart, the pair trying to hold above 100-SMA and any violation could see a dip till 2023 (4h 50-SMA). MACD line is below the signal line, while RSI is at 56. Also, the narrowing of the Bollinger bands suggest an upcoming change in trend.
Overall bias remains bullish as RSI is strong at 75 on the weekly chart, with MACD line above the signal line. In addition, all major moving averages are biased higher.
Recommendation: Wait for clear directional bias on the daily chart.
FxWirePro launches Absolute Return Managed Program. For more details, visit http://www.fxwirepro.com/invest

- News

- Economy

- Central Banks
- Investing
- Research
- Roundups
- Digital Currency
- Insights
- Technical Analysis
- Technology
- Business
- Law
- Health
- Nature
- Fintech
- Science
- Topic
- Opinions
- ©Econometrics LLC . All Rights Reserved.
FxWirePro: BTC/GBP rangebound, faces trend line resistance at 2165, bias neutral
Friday, June 23, 2017 10:51 AM UTC
Editor's Picks


- Market Data
Most Popular


