


 FxWirePro- Major Crypto levels and bias summary
  FxWirePro- Major Crypto levels and bias summary
  Ethereum Trails Bitcoin’s Retreat: Key Support Levels in Focus
  FxWirePro- Major Crypto levels and bias summary
  Bitcoin Retreats as Geopolitical Tensions Flare: BTC/USD Dips Following Iran’s Rejection of Ceasefire
  Ethereum’s $2,200 Ceiling: Can Diplomatic Breakthroughs Dissolve the Bearish Resistance?
  Ethereum Retreats in Bitcoin’s Shadow: ETH/USD Tests Critical Support at USD 2,075


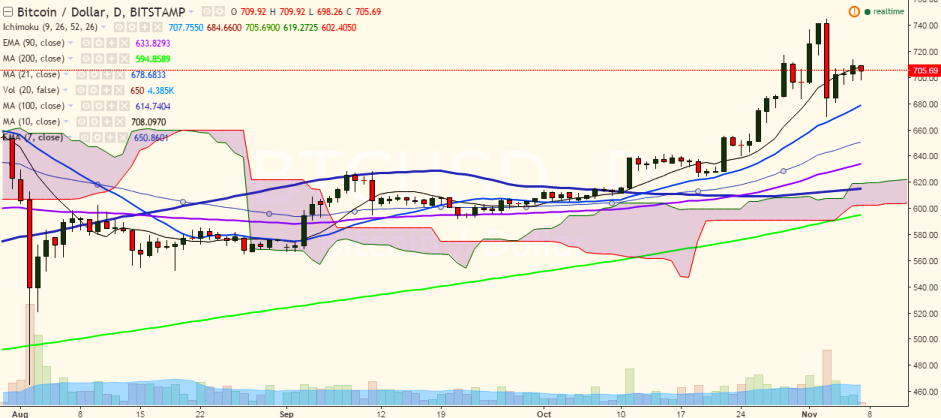
BTC/USD is gradually moving up after falling to 670.32 levels on November 03. It is currently trading at 707.29 levels (Bitstamp).
Long-term trend: Bullish
Short-term trend: Bullish
Ichimoku analysis of daily chart:
Tenkan Sen: 707.75
Kijun Sen: 684.66
Trend reversal: 632.21 (90 EMA)
On the upside, it faces major resistance at 745 levels (November 03 high) and a break above would see the pair testing 778.85 (June 18 high)/ 800.00.
On the downside, the pair is trying to hold its strength above the 700 mark. A break below would drag it to 675 (21-day MA) and then to 648 levels (55 EMA).

- News

- Economy

- Central Banks
- Investing
- Research
- Roundups
- Digital Currency
- Insights
- Technical Analysis
- Technology
- Business
- Law
- Health
- Nature
- Fintech
- Science
- Topic
- Opinions
- ©Econometrics LLC . All Rights Reserved.
BTC/USD takes support near 700, jump till 745 likely
Monday, November 7, 2016 7:37 AM UTC
Editor's Picks


- Market Data
Most Popular


