


 FxWirePro- Major Crypto levels and bias summary
  Bitcoin Retreats Toward Critical Support as Geopolitical Winds Shift
  Bitcoin Retreats as Geopolitical Tensions Flare: BTC/USD Dips Following Iran’s Rejection of Ceasefire
  FxWirePro- Major Crypto levels and bias summary
  Ethereum’s $2,200 Ceiling: Can Diplomatic Breakthroughs Dissolve the Bearish Resistance?
  FxWirePro- Major Crypto levels and bias summary


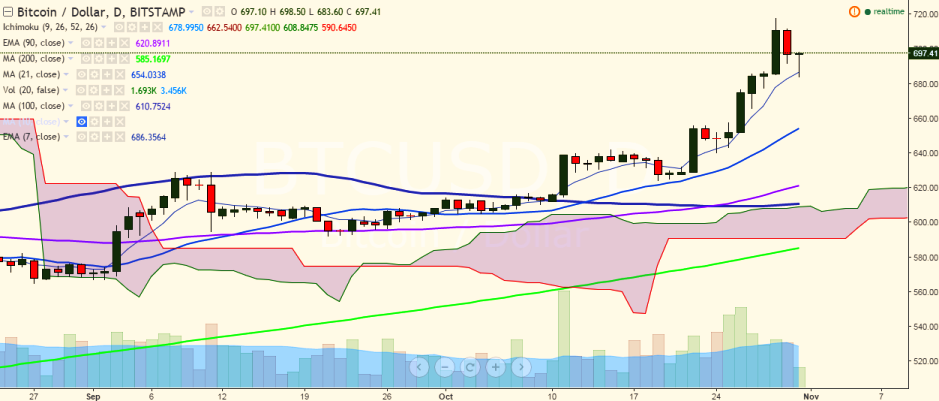
BTC/USD has slipped below the 700 mark after hitting 717.99 levels on October 29. It is currently trading at 696.40 levels (Bitstamp).
Long-term trend: Bullish
Short-term trend: Bullish
Ichimoku analysis of daily chart:
Tenkan Sen: 673.28
Kijun Sen: 661.87
Trend reversal: 619.17 (90 EMA)
“The pair has taken support near 7-EMA and is holding its strength above this level. Both short- and long-term trend are bullish for the pair and a jump till 730 is on the cards”, FxWirePro said in a statement.
On the topside, a break above 700.00 levels would see the pair testing 717.99 (October 29 high). Further strength would take it to 727.34 levels (127.2% retracement of 717.99 and 683.60).
On the flip side, support is seen at 686.16 (7-EMA) and any violation would target 650 (21-day MA)/619.17 (90 EMA).

- News

- Economy

- Central Banks
- Investing
- Research
- Roundups
- Digital Currency
- Insights
- Technical Analysis
- Technology
- Business
- Law
- Health
- Nature
- Fintech
- Science
- Topic
- Opinions
- ©Econometrics LLC . All Rights Reserved.
BTC/USD takes support near 7-EMA, break above 717 targets 730
Monday, October 31, 2016 8:19 AM UTC
Editor's Picks


- Market Data
Most Popular


