


 FxWirePro- Major Crypto levels and bias summary
  FxWirePro- Major Crypto levels and bias summary
  Ethereum’s $2,200 Ceiling: Can Diplomatic Breakthroughs Dissolve the Bearish Resistance?
  BTCUSD Coils in Tight Range: Will Geopolitical Stability Trigger a Breakout Toward $80,000?
  Ethereum Retreats in Bitcoin’s Shadow: ETH/USD Tests Critical Support at USD 2,075
  Bitcoin Retreats Toward Critical Support as Geopolitical Winds Shift
  Bitcoin Retreats as Geopolitical Tensions Flare: BTC/USD Dips Following Iran’s Rejection of Ceasefire


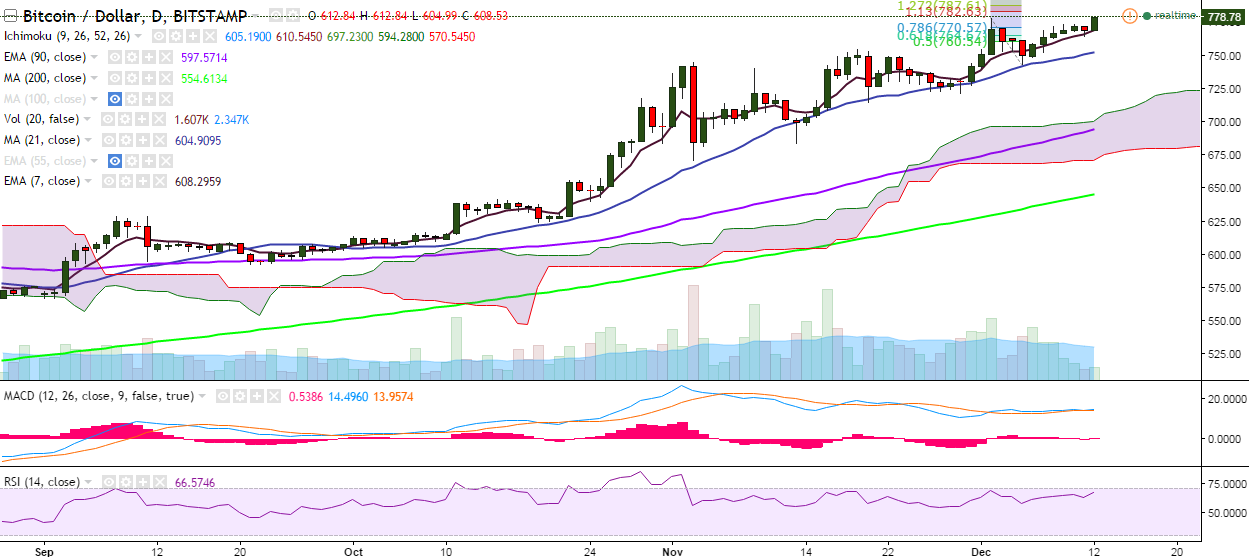
BTC/USD has broken above the June 18 high of 778.85 levels (December 02) and is trading at 779 levels at the time of writing (Bitstamp).
Long-term trend: Bullish
Short-term trend: Bullish
Ichimoku analysis of daily chart:
Tenkan Sen: 758.56
Kijun Sen: 743.25
Trend reversal: 691.77 (90 EMA)
A consistent break above 778.85 levels (June 18 high) would see the pair testing 799.74 levels (161.8% retracement of778.07 and 743)/ 819 (113% retracement of 778.85 and 465.28)/865.
On the downside, the pair has taken support near 765 (7-EMA) and a break below would drag it to 743 (December 05 low)/714 (November 20 low).

- News

- Economy

- Central Banks
- Investing
- Research
- Roundups
- Digital Currency
- Insights
- Technical Analysis
- Technology
- Business
- Law
- Health
- Nature
- Fintech
- Science
- Topic
- Opinions
- ©Econometrics LLC . All Rights Reserved.
BTC/USD hits 6-month high of 779, eyes 800
Monday, December 12, 2016 11:58 AM UTC
Editor's Picks


- Market Data
Most Popular


