


 Ethereum Retreats in Bitcoin’s Shadow: ETH/USD Tests Critical Support at USD 2,075
  Bitcoin Retreats as Geopolitical Tensions Flare: BTC/USD Dips Following Iran’s Rejection of Ceasefire
  FxWirePro- Major Crypto levels and bias summary
  BTCUSD Coils in Tight Range: Will Geopolitical Stability Trigger a Breakout Toward $80,000?
  Ethereum Trails Bitcoin’s Retreat: Key Support Levels in Focus
  Bitcoin Retreats Toward Critical Support as Geopolitical Winds Shift
  FxWirePro- Major Crypto levels and bias summary


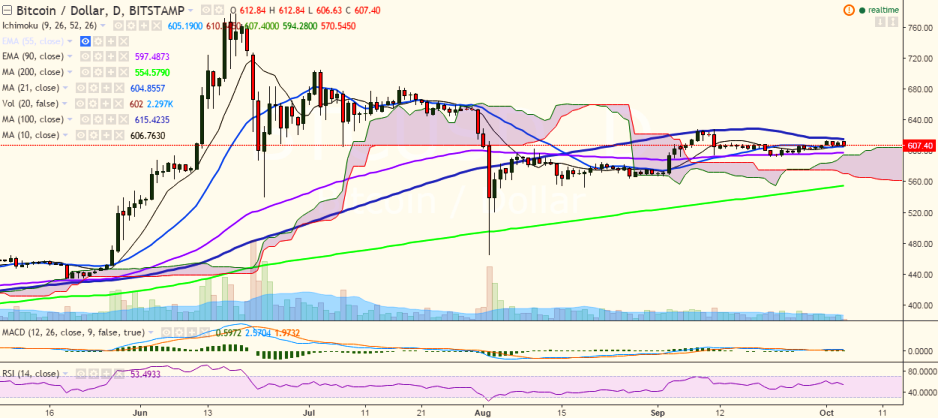
BTC/USD struggling to break above 100-day MA and is currently trading at 607 levels at the time of writing (Bitstamp).
Long-term trend: Bullish
Short-term trend: Bullish
Ichimoku analysis of daily chart:
Tenkan Sen: 605.14
Kijun Sen: 610.54
Trend reversal: 597.26 (90 EMA)
“The pair is trading in the red and has taken support near 605.95 (10-day MA). It must break above previous high of 614.28 for further upside and a close above 615.65 (100-day) will confirm bullishness in the pair”, FxWirePro said in a statement.
On the upside, BTC/USD faces strong resistance at 615.65 (100-day MA) and a break above would target 628.99 (September 11 high) and then 651.79 (161.8% retracement of 628.99 and 592.10).
On the reverse side, it has taken support near 605.65 (10-DMA) and a break below would target 600 (psychological levels)/ 597.26 (90 EMA)/ 578.39 (161.8% retracement of 592.10 and 614.28).

- News

- Economy

- Central Banks
- Investing
- Research
- Roundups
- Digital Currency
- Insights
- Technical Analysis
- Technology
- Business
- Law
- Health
- Nature
- Fintech
- Science
- Topic
- Opinions
- ©Econometrics LLC . All Rights Reserved.
BTC/USD faces strong resistance at 100-DMA, break above confirms bullishness
Tuesday, October 4, 2016 7:05 AM UTC
Editor's Picks


- Market Data
Most Popular


