


 Ethereum Retreats in Bitcoin’s Shadow: ETH/USD Tests Critical Support at USD 2,075
  BTCUSD Coils in Tight Range: Will Geopolitical Stability Trigger a Breakout Toward $80,000?
  Bitcoin Retreats as Geopolitical Tensions Flare: BTC/USD Dips Following Iran’s Rejection of Ceasefire
  FxWirePro- Major Crypto levels and bias summary
  Ethereum’s $2,200 Ceiling: Can Diplomatic Breakthroughs Dissolve the Bearish Resistance?
  Ethereum Trails Bitcoin’s Retreat: Key Support Levels in Focus
  FxWirePro- Major Crypto levels and bias summary
  FxWirePro- Major Crypto levels and bias summary
  FxWirePro- Major Crypto levels and bias summary


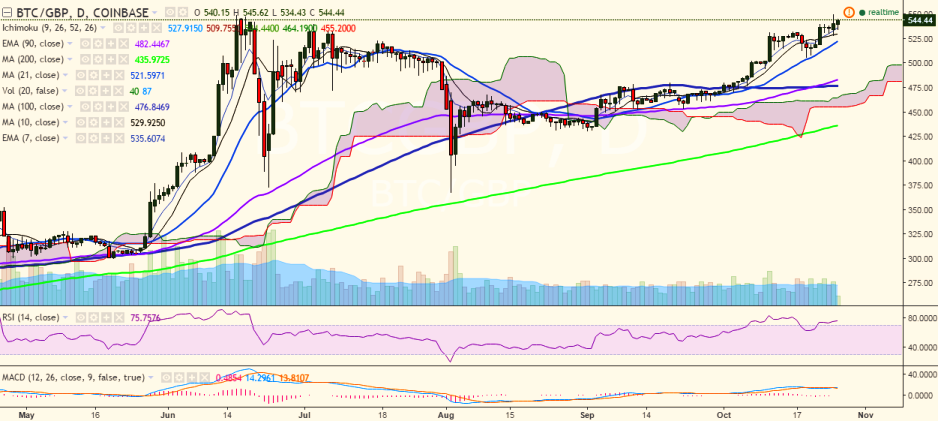
BTC/GBP hit a fresh high of 549.99 levels on Tuesday and is currently trading slightly lower at 544.44 levels at the time of writing (Coinbase).
Long-term trend: Bullish
Short-term trend: Bullish
Ichimoku analysis of daily chart:
Tenkan Sen: 522.92
Kijun Sen: 502.70
Trend reversal: 479.69 (90 EMA)
“The pair has taken support at 10-day MA and broken above the previous high of 540 levels. Both short-and long-term trend appears bullish for the pair and a jump till 575 seems likely”, FxWirePro said.
On the topside, a break above yesterday’s high of 549.99 levels would see further bullishness in the pair, taking it to 573 (113% retracement of 549.45 and 367.10).
On the flipside, support is seen at 528.59 (10-day MA) and a break below would target 518.74/505.84 (October 19 low).

- News

- Economy

- Central Banks
- Investing
- Research
- Roundups
- Digital Currency
- Insights
- Technical Analysis
- Technology
- Business
- Law
- Health
- Nature
- Fintech
- Science
- Topic
- Opinions
- ©Econometrics LLC . All Rights Reserved.
BTC/GBP hits fresh high of 549.99, jump till 575 likely
Wednesday, October 26, 2016 11:17 AM UTC
Editor's Picks


- Market Data
Most Popular


