


 AI Memory Boom Sparks Global Chip Supply Crunch
  J.P. Morgan Sees Potential Vestas Guidance Upgrade Amid Strong Wind Energy Demand
  Silver Cracks Key 365-Day EMA for First Time Since Feb 2024; Bears Eye $50 on Rallies
  With Iran and the US signing a peace deal, where does that leave Benjamin Netanyahu?
  Goldman Sachs: US Dollar Likely to Stay Strong Despite Oil Price Retreat
  Trump’s Iran Strategy: What Has Been Achieved After Three Months of Conflict?
  World Cup technology: from ref cams to AI analysts, cutting-edge research is changing the game
  China’s AI Manufacturing Boom Masks Weak Consumer Economy, Citi Says
  Bank Regulation Rollbacks in the U.S. and UK Could Increase Financial Risks, Study Warns
  SpaceX Stock Gets $175 Target as Analysts See Massive Growth Ahead


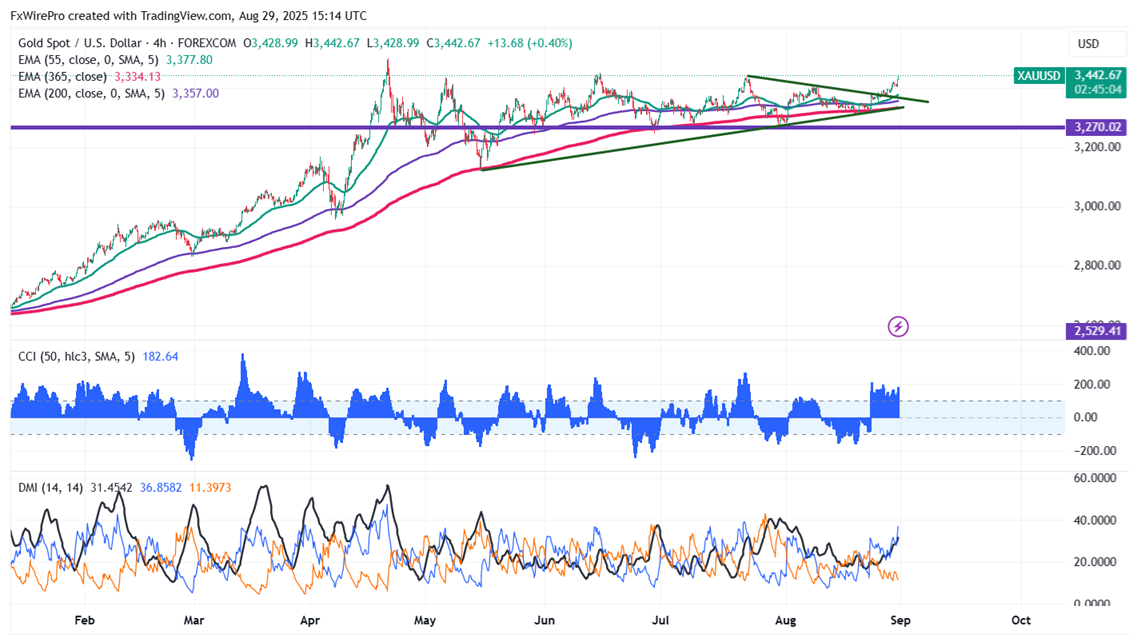
Gold prices gained sharply after the US inflation data. It hit an intraday high of $3441.58 and is currently trading around $3440.
The US Core PCE Price Index, released on August 29, 2025, rose 0.3% month-over-month in July, matching economists' expectations and June's rate, while the annual rate increased to 2.9% from 2.8%, the highest since February 2025. Excluding volatile food and energy prices, this key Federal Reserve inflation gauge indicates persistent inflationary pressures, complicating potential interest rate cuts in September 2025 as policymakers balance price stability and economic growth.
According to the CME Fed Watch tool, the chances of 25 bpbs rate cut in Sep 17th 2025 meeting have increased to 89.20% from 84.70% a week ago.
Technical Analysis: Key Levels and Trading Strategy
Gold prices are holding above the short-term moving average 34 EMA and 55 EMA) and the long-term moving averages (200 EMA) on the 4-hour chart. Immediate support is at $3410, and a break below this level will drag the yellow metal to $3375/$3356/$3320 $3300/$3290/$3275/$3245/$3200. The near-term resistance is at $3450 with potential price targets at $3475/$3500/$3550.
It is good to buy on dips around $3410-12 with a stop-loss at $3375 for a target price of $3500.


