


 AUDJPY Weakness Deepens: Sell Rallies Toward 112 as Aussie Dollar Falters
  NZDJPY Pullback: Sell Rallies Toward 93.30 as Yen Weakness Eases
  FxWirePro: USD/CAD gaining momentum for a move towards 1.4200 level
  FxWirePro: USD/JPY eases ahead of Fed decision , Intervention risks linger
  FxWirePro: USD/ZAR retreats but trend is still bullish
  FxWirePro: GBP/AUD gains some upside momentum but still bearish
  FxWirePro : USD/JPY holds relatively bid on 163 ahead Of FOMC,BoJ meetings
  FxWirePro: EUR/NZD up trend gains momentum but hurdles ahead
  FxWirePro: GBP/NZD maintains bersish bias with focus on 2.2900 level
  FxWirePro- Woodies pivot (Major)
  EUR/JPY Holds Bullish Bias as Euro Extends Recovery
  Crypto Action Bias: ETHUSD Stands Out as the Bullish Pair to Watch
  JPY Pairs Action Bias: EURJPY Leads as Bullish Standout Amid Mixed Momentum
  FxWirePro: NZD/USD neutral in the near-term, scope for downward resumption
  JPY Action Bias: USDJPY Emerges as the Clear Bullish Pair to Watch Amid Mixed Crosses
  FxWirePro: EUR/ AUD gains some ground , but remains on bearish path


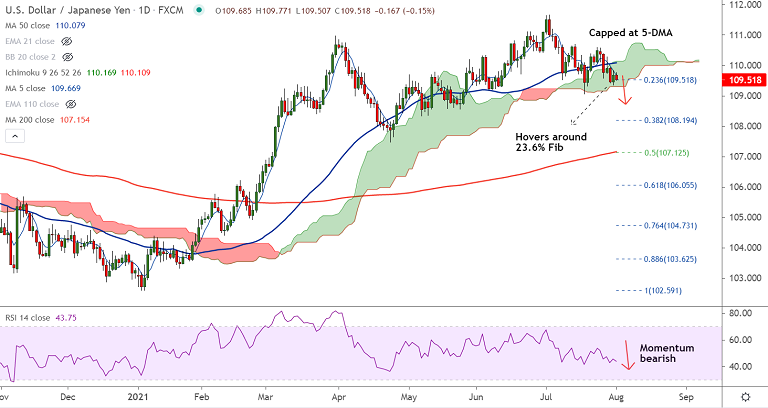
USD/JPY chart - Trading View
Technical Analysis: Bias Bearish
- USD/JPY was trading 0.12% lower on the day at 109.53 at around 11:20 GMT
- Momentum indicators are biased lower, RSI is below the 50 mark
- Price action is within the daily cloud, upside remains capped at 5-DMA
- MACD is below zero and ADX is rising in support of downside
- Chikou span is biased lower and breach below cloud will drag the pair lower
- Price action has slipped below 200H MA and GMMA indicator shows bearish shift on the intraday charts
Support levels - 109.29 (Cloud base), 109.09 (110-EMA), 108.85 (200-week MA)
Resistance levels - 109.67 (5-DMA), 109.85 (55-EMA), 110.01 (21-EMA)
Summary: USD/JPY weakens modestly ahead of US PMI data. US Manufacturing PMI for July is expected to arrive at 60.9, slightly above 60.6 in the prior month.
Focus remains on the Prices Paid component of the survey and a stronger-than-expected reading could provide a boost to the USD.
Technical bias for the pair is bearish. Breach below cloud base support could drag the pair lower. Next major support lies at 110-EMA at 109.09 ahead of 200-week MA at 108.85.
On the flip side, 5-DMA is immediate resistance at 109.67. Bearish invalidation only above daily cloud.


