


 Moldova Criticizes Russia Amid Transdniestria Energy Crisis
  Moody's Upgrades Argentina's Credit Rating Amid Economic Reforms
  Bank of America Posts Strong Q4 2024 Results, Shares Rise
  Oil Prices Dip Slightly Amid Focus on Russian Sanctions and U.S. Inflation Data
  Pound-Yen Pullback: GBP/JPY Slips Below Key EMAs as Sterling Weakness Fuels Bearish Bet on 210
  FxWirePro: USD/CNY hits one –month high, scope for further upside
  FxWirePro: GBP/NZD gaining momentum for a move towards 2.3350level
  Lithium Market Poised for Recovery Amid Supply Cuts and Rising Demand
  FxWirePro: AUD/USD eases after Australian mixed CPI data
  FxWirePro: USD/CAD steadies around 1.3990 ,retains bid one
  Urban studies: Doing research when every city is different
  Aussie-Yen Trapped Below 113: Sell the Bounce as Bears Reload for a Run at 110
  Pound-Yen Pullback: GBP/JPY Slips Below Key EMAs as Sterling Weakness Fuels Bearish Bet on 210
  Geopolitical Easing Fuels AUDJPY Rally Toward 115 — Buy Dips at 113
  FxWirePro- Major Crypto levels and bias summary
  Gold Prices Slide as Rate Cut Prospects Diminish; Copper Gains on China Stimulus Hopes


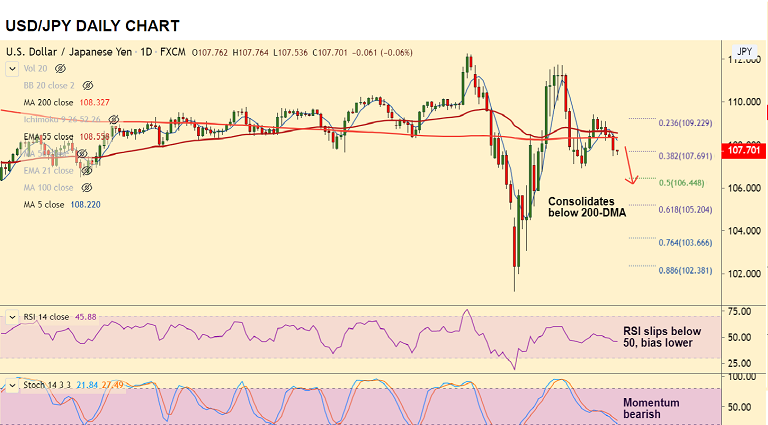
USD/JPY chart - Trading View
USD/JPY was trading 0.07% lower on the day at 06:25 GMT, after closing 0.55% lower in the previous session.
The major was consolidating break below 200-DMA, extending bearish run for the 4th straight session.
GMMA indicator shows major trend in the pair is neutral, while minor trend is turning bearish.
Stochs and RSI also support weakness. Price action has fallen below 200H MA. Further downside likely.
Market sentiment will likely continue to be the key driver. Retail sales and industrial production reports due Wednesday will be watched for further impetus.
Support levels - 106.92 (Apr 1st low), 106.44 (50% Fib)
Resistance levels - 1008.22 (5-DMA), 108.32 (200 DMA)


