


 FxWirePro- Major Crypto levels and bias summary
  Ethereum Retreats in Bitcoin’s Shadow: ETH/USD Tests Critical Support at USD 2,075
  BTCUSD Coils in Tight Range: Will Geopolitical Stability Trigger a Breakout Toward $80,000?
  Ethereum’s $2,200 Ceiling: Can Diplomatic Breakthroughs Dissolve the Bearish Resistance?


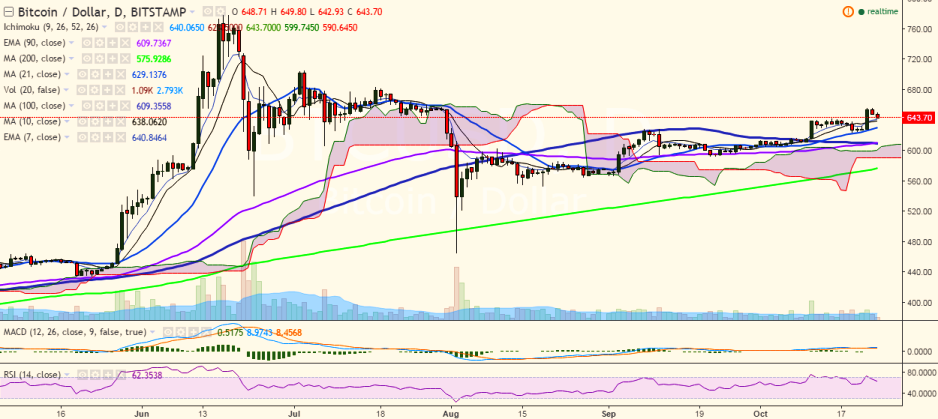
BTC/USD is showing a slight dip after hitting 656 levels on October 22. It is currently trading at 644 levels at the time of writing (Bitstamp).
Long-term trend: Bullish
Short-term trend: Bullish
Ichimoku analysis of daily chart:
Tenkan Sen: 640
Kijun Sen: 628.50
Trend reversal: 608.97 (90 EMA)
“The pair broke above the 650.00 mark and hit 656 levels. It is likely to find support at 7 EMA. Both short- and long-term trend appear bullish for the pair and a jump till 684 is possible”, FxWirePro said in a statement.
Immediate resistance is seen at 656 (October 22 high) and a break above would see the pair testing 663.85 (161.8% retracement of 656 and 643.30)/684.19 (July 17 high).
On the downside, support is seen at 639.89 (7 EMA) and a break below would target 627.58 (21-day MA)/ 608.97 (90 EMA).

- News

- Economy

- Central Banks
- Investing
- Research
- Roundups
- Digital Currency
- Insights
- Technical Analysis
- Technology
- Business
- Law
- Health
- Nature
- Fintech
- Science
- Topic
- Opinions
- ©Econometrics LLC . All Rights Reserved.
FxWirePro: BTC/USD takes support near 7-EMA, good to buy on dips
Monday, October 24, 2016 7:25 AM UTC
Editor's Picks


- Market Data
Most Popular


