


 Bitcoin Retreats as Geopolitical Tensions Flare: BTC/USD Dips Following Iran’s Rejection of Ceasefire
  BTCUSD Coils in Tight Range: Will Geopolitical Stability Trigger a Breakout Toward $80,000?
  FxWirePro- Major Crypto levels and bias summary
  Ethereum Trails Bitcoin’s Retreat: Key Support Levels in Focus
  FxWirePro- Major Crypto levels and bias summary
  Ethereum Retreats in Bitcoin’s Shadow: ETH/USD Tests Critical Support at USD 2,075


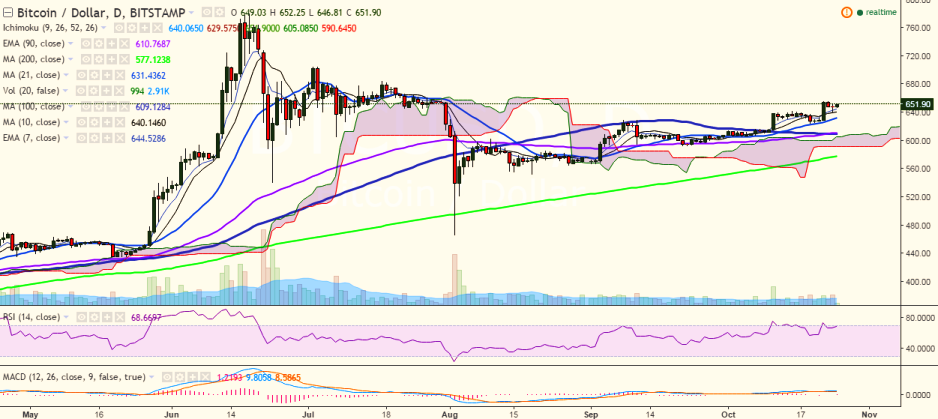
BTC/USD hit 640 levels on Monday before closing at 648.60 levels. Today, the pair is struggling for a consistent break above 650 levels and is trading at 651 levels at the time of writing (Bitstamp).
Long-term trend: Bullish
Short-term trend: Bullish
Ichimoku analysis of daily chart:
Tenkan Sen: 640
Kijun Sen: 628.50
Trend reversal: 609.84 (90 EMA)
“The pair has taken support near 638 levels (10-day MA) and is facing minor resistance at 652 levels (78.6% retracement of 656 and 640. A break above the previous high of 656 levels would target 685 levels”, FxWirePro said in a statement.
The pair faces major resistance at 656 (October 22 high) and a break above would target 663.85 (161.8% retracement of 656 and 643.30)/684.19 (July 17 high).
On the downside, support is seen at 638.55 levels (10-day MA) and any violation would drag it to 629.37 (21-day MA)/ 609.84 (90 EMA).

- News

- Economy

- Central Banks
- Investing
- Research
- Roundups
- Digital Currency
- Insights
- Technical Analysis
- Technology
- Business
- Law
- Health
- Nature
- Fintech
- Science
- Topic
- Opinions
- ©Econometrics LLC . All Rights Reserved.
FxWirePro: BTC/USD hovers around 650, good to go long above 656
Tuesday, October 25, 2016 8:37 AM UTC
Editor's Picks


- Market Data
Most Popular


