


 FxWirePro- Major Crypto levels and bias summary
  Bitcoin Retreats as Geopolitical Tensions Flare: BTC/USD Dips Following Iran’s Rejection of Ceasefire
  Ethereum Retreats in Bitcoin’s Shadow: ETH/USD Tests Critical Support at USD 2,075
  FxWirePro- Major Crypto levels and bias summary
  Bitcoin Retreats Toward Critical Support as Geopolitical Winds Shift


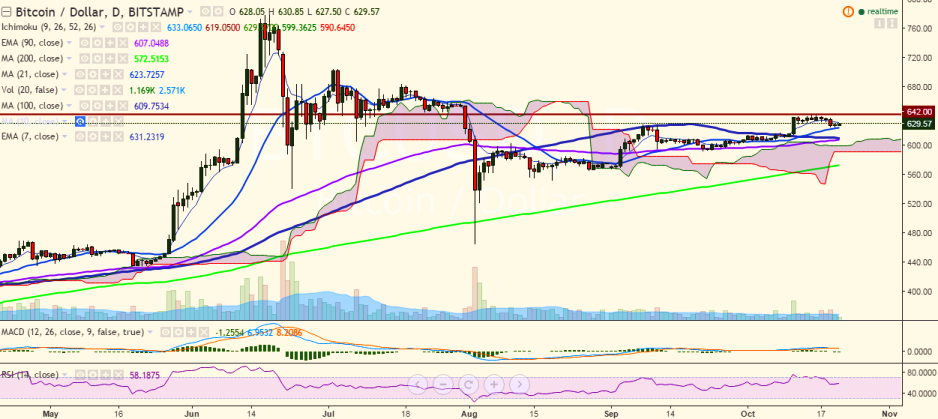
BTC/USD is trading in a narrow range between 625 and 630 levels. It is currently trading at 629.57 levels (Bitstamp).
Long-term trend: Bullish
Short-term trend: Bullish
Ichimoku analysis of daily chart:
Tenkan Sen: 633
Kijun Sen: 619
Trend reversal: 606.54 (90 EMA)
“The pair is gradually moving upwards after hitting 624.13 (October 19 low) and the short-term trend appears bullish. Its upside is currently capped by 7 EMA and must break above October 15 high of 642 levels for further bullish trend”, FxWirePro said in a statement.
Immediate resistance is seen at 631.78 (7-EMA) and a break above would see the pair testing 642 levels (October 15 high) /653 levels (161.8% retracement of 642 and 624.13).
On the downside, support is seen at 622.70 (21-day MA) and a break below would target 606.54 (90 EMA)/592 (September 21 low).

- News

- Economy

- Central Banks
- Investing
- Research
- Roundups
- Digital Currency
- Insights
- Technical Analysis
- Technology
- Business
- Law
- Health
- Nature
- Fintech
- Science
- Topic
- Opinions
- ©Econometrics LLC . All Rights Reserved.
BTC/USD consolidates in a narrow range, break above 642 targets 653
Friday, October 21, 2016 9:27 AM UTC
Editor's Picks


- Market Data
Most Popular


