


 Dulles Airport Rebuild Plan Could Transform Washington’s Main International Gateway
  YouTube and Snap Settle School District Mental Health Lawsuit Ahead of Major Social Media Trial
  Alibaba Stock Surges After Strong Q4 Earnings Boosted by AI and Cloud Growth
  Anthropic Nears $30 Billion Funding Round at $900 Billion Valuation
  OpenAI Finds No Evidence of User Data Breach in TanStack npm Supply-Chain Attack
  Nidec Shares Plunge After Quality Inspection Misconduct Allegations
  Alphabet Raises Record $3.6 Billion in Yen Bonds to Support AI Expansion
  BlackRock-Led GCC Infrastructure Partnership Targets $30 Billion Investment
  DOJ May Drop Gautam Adani Fraud Charges Amid $10 Billion U.S. Investment Plan
  US-China Trade Talks Sideline Chip Export Controls as Nvidia China Sales Draw Attention
  FTC Antitrust Probe Targets Arm Holdings Over Chip Licensing Practices
  Asia-Pacific Banks Brace for Rising Credit Risks Amid Iran Conflict


“Handy bit of research finds sexuality can be determined by the lengths of people’s fingers” was one recent headline based on a peer-reviewed study by well-respected researchers at the University of Essex published in the Archives of Sexual Behavior, the leading scholarly publication in the area of human sexuality.
And, to my stats-savvy eye, it is a bunch of hogwash.
Just when it seems that news consumers may be wising up – remembering to ask if science is “peer-reviewed,” the sample size is big enough or who funded the work – along comes a suckerpunch of a story. In this instance, the fast one comes in the form of confidence intervals, a statistical topic that no lay person should really ever have to wade through to understand a news article.
But, unfortunately for any number-haters out there, if you don’t want to be fooled by breathless, overhyped or otherwise worthless research, we have to talk about a few statistical principles that could still trip you up, even when all the “legitimate research” boxes are ticked.
What’s my real risk?

Yum? Leo/Flickr, CC BY-NC-ND
One of the most depressing headlines I ever read was “Eight-year study finds heavy French fry eaters have ‘double’ the chance of death.” “Ugh,” I said out loud, sipping my glass of red wine with a big ole basket of perfectly golden fries in front of me. Really?
Well, yes, it’s true according to a peer-reviewed study published in the American Journal of Clinical Nutrition. Eating french fries does double your risk of death. But, how many french fries, and moreover, what was my original risk of death?
The study says that if you eat fried potatoes three times per week or more, you will double your risk of death. So let’s take an average person in this study: a 60-year-old man. What is his risk of death, regardless of how many french fries he eats? One percent. That means that if you line up 100 60-year-old men, at least one of them will die in the next year simply because he is a 60-year-old man.
Now, if all 100 of those men eat fried potatoes at least three times per week for their whole lives, yes, their risk of death doubles. But what is 1 percent doubled? Two percent. So instead of one of those 100 men dying over the course of the year, two of them will. And they get to eat fried potatoes three times a week or more for their entire lives – sounds like a risk I’m willing to take.
This is a statistical concept called relative risk. If the chance of getting some disease is 1 in a billion, even if you quadruple your risk of coming down with it, your risk is still only 4 in a billion. It ain’t gonna happen.
So next time you see an increase or decrease in risk, the first question you should ask is “an increase or decrease in risk from what original risk.”
Plus, like me, could those men have been enjoying a glass of wine or pint of beer with their fried potatoes? Could something else have actually been the culprit?
Eating cheese before bed equals die by tangled bedsheets?
Baby boxes have become a trendy state-sponsored gift to new parents, meant to provide newborns with a safe place to sleep. The initiative grew from a Finnish effort started in the late 1930s to reduce sleep-related death in infants. The cardboard box includes a few essentials: some diapers, baby wipes, a onesie, breast pads and so on.
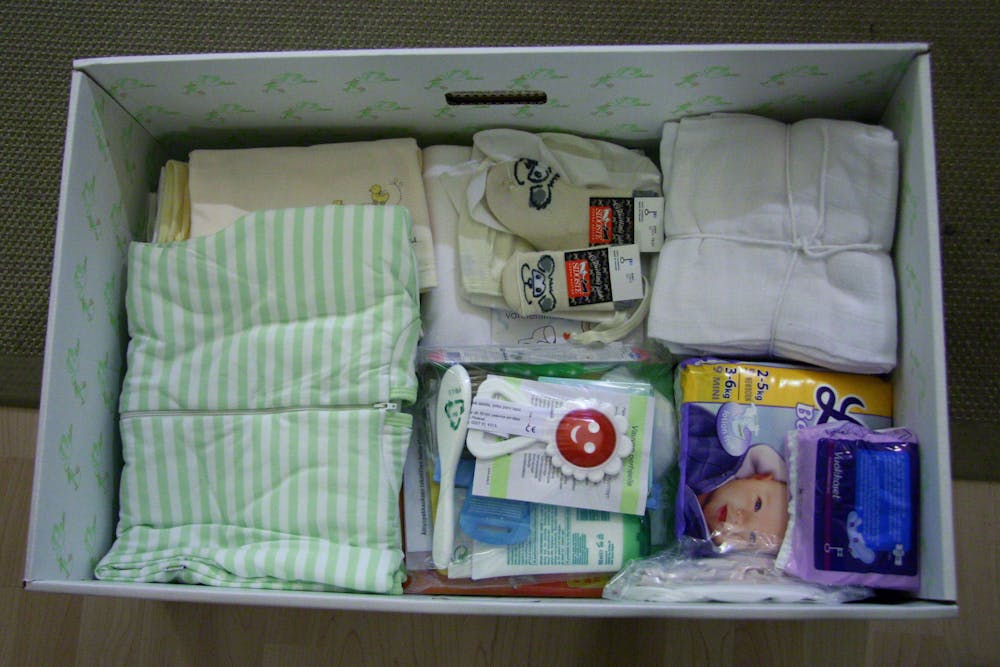
Contents of a Finnish ‘maternity package’ before a newborn baby moves in. Visa Kopu/Flickr, CC BY-NC-ND
Finland’s infant mortality rate decreased at a rapid rate with the introduction of these baby boxes, and the country now has one of the lowest infant mortality rates in the world. So it makes sense to suppose that these baby boxes caused the infant mortality rate to go down.
But guess what also changed? Prenatal care. In order to qualify for the baby box, a woman was required to visit health clinics starting during the first four months of her pregnancy.
In 1944, 31 percent of Finnish mothers received prenatal education. In 1945, it had jumped to 86 percent. The baby box was not responsible for the change in infant mortality rates; rather, it was education and early health checks.
This is a classic case of correlation not being the same as causation. The introduction of baby boxes and the decrease in infant mortality rates are related but one didn’t cause the other.
However, that little fact hasn’t stopped baby box companies from popping up left, right and center, selling things like the “Baby Box Bundle: Finland Original” for a mere US$449.99. And U.S. states use tax dollars to hand a version out to new mothers.
So the next time you see a link or association – like how eating cheese is linked to dying by becoming entangled in your bedsheets – you should ask “What else could be causing that to happen?”
When margin of error is bigger than the effect
Recent numbers from the Bureau of Labor Statistics show national unemployment dropping from 3.9 percent in August to 3.7 percent in September. When compiling these figures, the bureau obviously doesn’t go around asking every person whether they have a job or not. It asks a small sample of the population and then generalizes the unemployment rate in that group to the entire United States.
This means the official level of unemployment at any given time is an estimate – a good guess, but still a guess. This “plus or minus error” is defined by something statisticians call a confidence interval.
What the data actually says is that it appears the number of unemployed people nationwide decreased by 270,000 – but with a margin of error, as defined by the confidence interval, of plus or minus 263,000. It’s easier to announce a single number like 270,000. But sampling always comes with a margin of error and it’s more accurate to think of that single estimate as a range. In this case, statisticians believe the real number of unemployed people went down by somewhere between just 7,000 on the low end and 533,000 on the high end.
This is the same issue that happened with the finger length defining sexuality study - the plus or minus error associated with these estimates can simply negate any certainty in the results.
The most obvious example of confidence intervals making our lives confusing is in polling. Pollsters take a sample of the population, ask who that sample is going to vote for, and then infer from that what the entire population is going to do on Election Day. When the races are close, the plus or minus error associated with their polls of the sample negate any real knowledge of who is going to win, making the races “too close to call.”
So the next time you see a number being stated about an entire population where it would have been impossible to ask every single person or test every single subject, you should ask about the plus or minus error.
Will knowing these three aspects of statistical misleads mean that you never get fooled? Nope. But they sure will help.


