


 BTCUSD Coils in Tight Range: Will Geopolitical Stability Trigger a Breakout Toward $80,000?
  FxWirePro- Major Crypto levels and bias summary
  Bitcoin Retreats as Geopolitical Tensions Flare: BTC/USD Dips Following Iran’s Rejection of Ceasefire
  FxWirePro- Major Crypto levels and bias summary
  FxWirePro- Major Crypto levels and bias summary
  Ethereum’s $2,200 Ceiling: Can Diplomatic Breakthroughs Dissolve the Bearish Resistance?


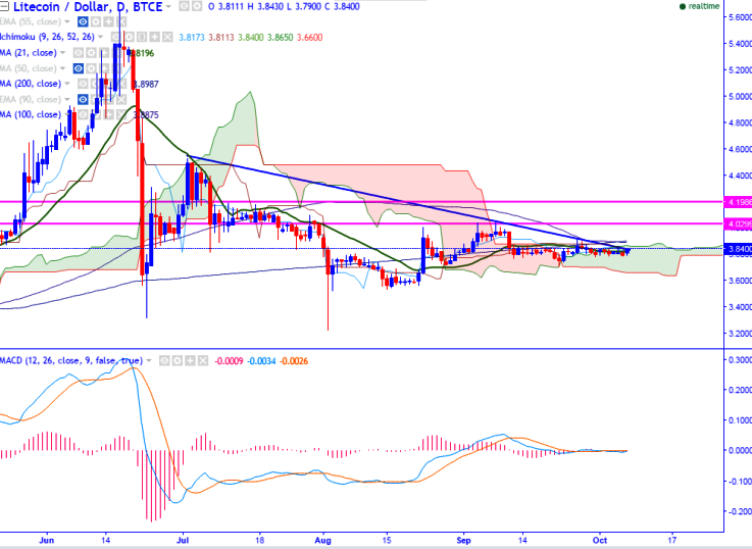
LTC/USD is seen trading above on Friday. The pair has slightly recovered from the low of $3.78 made yesterday (BTCE). It is currently trading around $3.840 at the time of writing.
Ichimoku analysis of daily chart shows:
Tenkan-Sen $3.8225
Kijun-Sen $3.8408
Trend reversal - $3.88
Long-term trend remains to be bullish. The short-term trend seems to be bearish. In the daily chart, the pair breaks trend line resistance at $3.840 (trend line joining $4.53 and $4.05). So slight jump till $3.92/$4 is possible.
Major resistance is around $3.840 (trend line joining $4.53 and $4.05) and any break above will take the pair till $3.8925 (200 days MA)/$3.92 (Sep 26th 2016)/$4.05 (Sep 8th high). Major support is seen at $3.78 (Sep 30th low) and break below will drag the pair till $3.70 (Sep 22nd low)/$3.53 (Aug 15th, 2016 low).

- News

- Economy

- Central Banks
- Investing
- Research
- Roundups
- Digital Currency
- Insights
- Technical Analysis
- Technology
- Business
- Law
- Health
- Nature
- Fintech
- Science
- Topic
- Opinions
- ©Econometrics LLC . All Rights Reserved.
LTC/USD breaks minor trend line resistance, slight jump till $4.05 likely
Friday, October 7, 2016 12:33 PM UTC
Editor's Picks


- Market Data
Most Popular


