


 Wall Street Futures Slip After Record Rally Fueled by Iran Peace Hopes and AMD Surge
  U.S.-China Beef Trade Deal Hopes Rise Ahead of Trump-Xi Summit
  Lula and Trump Talks Signal New Phase in Brazil-US Relations
  Gold Prices Rise as Weaker Dollar and U.S.-Iran Peace Hopes Boost Demand
  Iran-U.S. Peace Deal Near as Oil Prices Fall and Nuclear Disputes Persist
  Gold Prices Hold Firm as Iran Tensions and Dollar Swings Drive Safe-Haven Demand
  Oil Prices Rebound Slightly After Sharp Drop on Iran Deal Hopes
  Trump Signals Possible U.S.-Iran Peace Deal as Markets Rally on Hopes of War Ending
  Asian Stocks Slide as Iran Tensions Escalate Despite Strong Weekly Gains
  Asian Stocks Rally as Japan’s Nikkei Hits Record High on U.S.-Iran Peace Optimism
  Dollar Weakens as Iran Peace Hopes Boost Risk Appetite and Yen Gains Strength
  Wall Street Futures Edge Higher as Iran Tensions and AI Optimism Shape Markets
  China Export Growth Surges in April as Global Buyers Rush to Secure Supplies
  Dollar Slips as Strong U.S. Jobs Data Reduces Fed Rate Cut Expectations
  Oil Prices Surge as U.S.-Iran Conflict Threatens Strait of Hormuz Supply Route
  US-Iran Ceasefire Under Pressure as Fresh Strait of Hormuz Clashes Shake Oil Markets


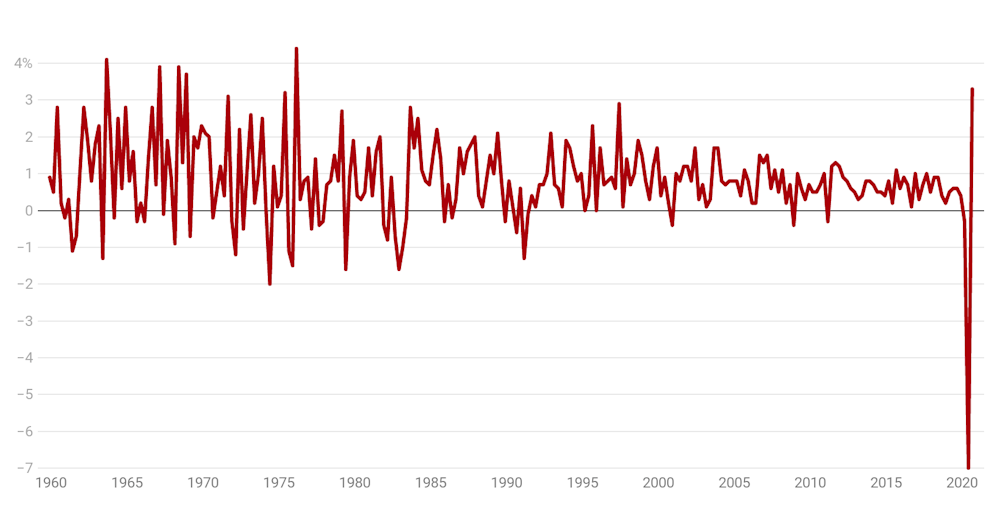
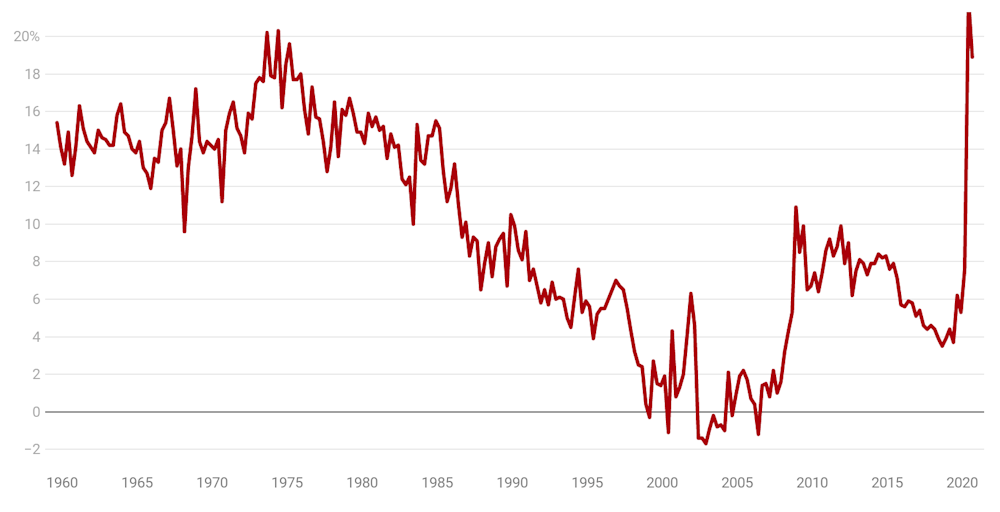
It’d be wrong to say that we are out of recession, although that’s how the graph of Wednesday’s GDP numbers makes it look.
Gross domestic product (the measure of everything produced and earned and spent) fell 7% between the March and June quarters after slipping 0.3% between the December and March quarters, and then rebounded 3.3% between the June and September quarters.
It was the biggest bounce since 1976, after the biggest fall on record.
Quarterly percentage change in gross domestic product
But it hasn’t anything like got us back to where we were.
When the levels rather than the changes in GDP are graphed, it is clear that, as Treasurer Josh Frydenberg put it, we have “a lot of ground to make up”.
Quarterly real gross domestic product
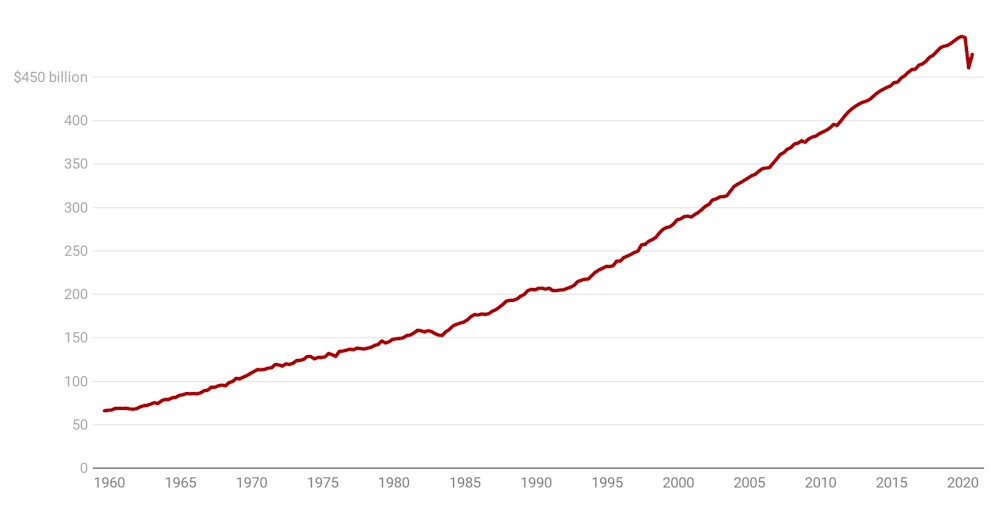
At first sight the graph of quarterly gross domestic product looks odd. Surely if GDP fell 7% and then rebounded by half that much it should have got back half its losses.
But 3.3% of a small number is much less than 7% of a bigger number. We’ve regained only two fifths of what we lost.
And we’ve lost more than that. Had the economy grown as the Reserve Bank forecast before the coronavirus crisis, we would have spent and earned A$509 billion in the September quarter instead of $476 billion.
It’s consumer spending that’s bounced
What drove the bounce was a rebound in consumer spending after months in which we were confined to quarters, and here the news is better than it seems.
Quarterly change in household final consumption expenditure
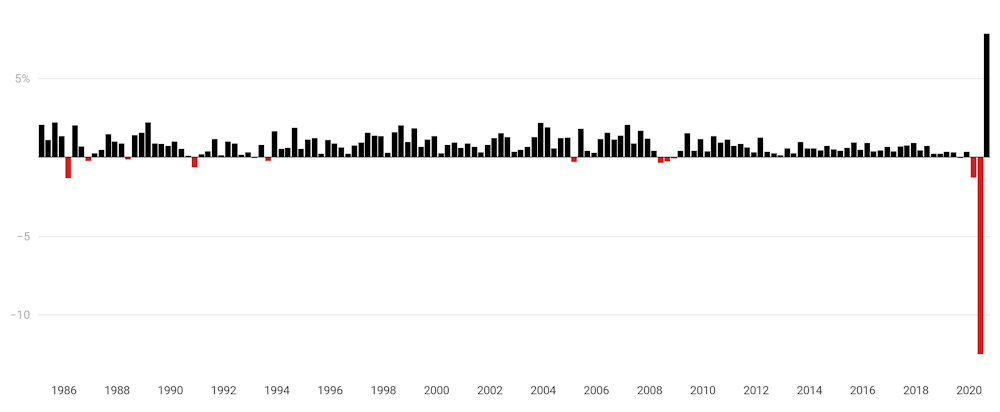
ABS Australian National Accounts
Nationwide, household spending jumped 7.9% after falling 12.5%, but excluding locked-down Victoria (which will have its own delayed bounceback) household spending in the rest of the country rebounded 11% after falling 12%.
And it bounced back in exactly the places it collapsed while we were locked down; in services such as tourism and hospitality.
Household spending by category

National, percentage change between June quarter and September quarter. Australian Treasury
Victoria’s economy literally went backwards.
Spending in Victoria continued to fall while spending everywhere else bounced back.
In only one category, home alcohol consumption, did spending in Victoria advance while spending in other places retreated.
State and territory final demand, September quarter
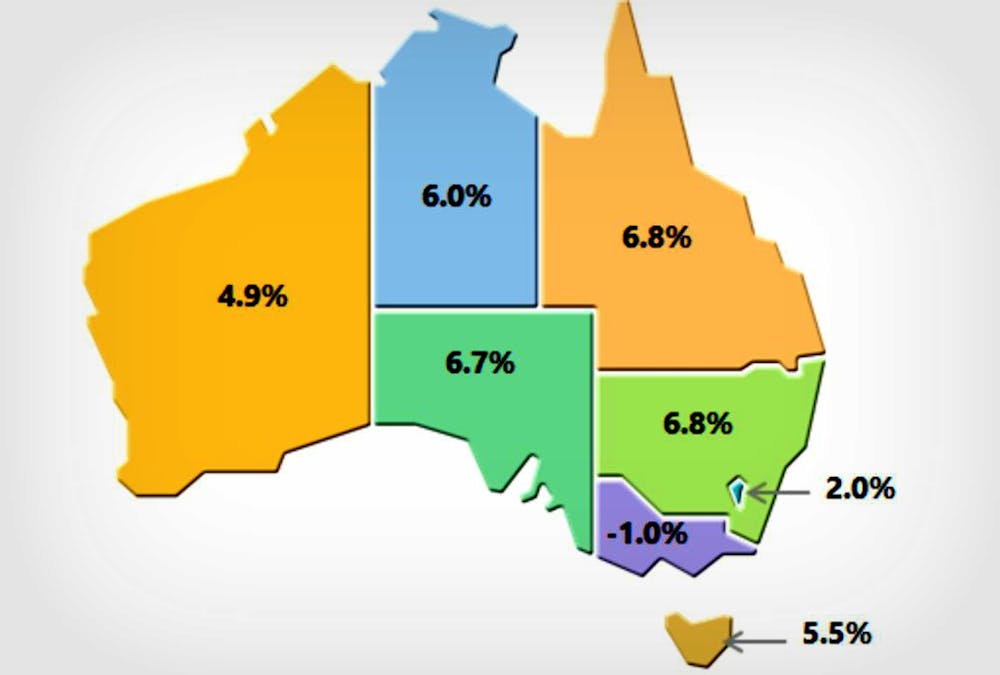
ABS Australian National Accounts
Consumers financed the extra spending by saving less, but even so, Australia’s household saving ratio remained alarmingly high.
In the June quarter Australian households saved a record (upwardly revised) 22.1% of what they earned. In the September quarter that fell to 18.9%, which is still far too high.
In good times, less-worried Australians save less than half that.
Household saving ratio
ABS Australian National Accounts
Frydenberg put the best spin he could on the extraordinarily high amount of saving by saying it would provide “ongoing support for the economic recovery in the new year as confidence continues to build”.
Australia was as well positioned to recover as “any nation on earth”. Over the past year its economy has contracted less than Britain, France, Germany and Japan.
Exports, business investment continue to fall
Much of that success is due to Australia’s achievement in getting on top of the virus and the success of JobKeeper in keeping Australians in work until conditions improved. The Reserve Bank believes it saved 700,000 jobs.
Working against that has been the forth consecutive quarterly fall in export income (something set to worsen unless relations with China improve) and the sixth consecutive fall in business investment.
In a quarter when consumer spending recovered, non-mining business investment fell a further 3% on top of a fall of 8.6% in the previous quarter.
The US National Bureau of Economic Research defines a recession as
a significant decline in economic activity spread across the economy, lasting more than a few months, normally visible in real GDP, real income, employment, industrial production and wholesale-retail sales
On that basis Australia is still in one. Employment, income and production remain well down on where it was a year ago. GDP is down 3.8% on where it was a year ago.
Speaking as the national accounts were being released, Reserve Bank Governor Philip Lowe said he expected Australia’s unemployment rate to remain above 6% for the next two years.
Annual wage growth would remain less than 2%
It was possible the economy could do better.
His forecasts assume no widespread vaccination against coronavirus until late next year. They also assume international travel restrictions until 2022.
But it was also possible things could be worse.
Just three months ago that many were hailing a robust bounce-back in Europe.
Now, Europe’s economy is expected to sink again in the December quarter as member states struggle to contain the virus.
Australia was on a different path, but there was “no guarantee we will remain so”.


