


 Gold Prices Slide as Rate Cut Prospects Diminish; Copper Gains on China Stimulus Hopes
  FxWirePro- Major Crypto levels and bias summary
  U.S. Stocks vs. Bonds: Are Diverging Valuations Signaling a Shift?
  S&P 500 Relies on Tech for Growth in Q4 2024, Says Barclays
  U.S. Treasury Yields Expected to Decline Amid Cooling Economic Pressures
  2025 Market Outlook: Key January Events to Watch
  Oil Prices Dip Slightly Amid Focus on Russian Sanctions and U.S. Inflation Data


The US WTI crude August contract inched higher 2 cents, or around 0.04%, to $46.06 a barrel, Brent futures for September delivery on the ICE Futures Exchange in London inched up 5 cents, to $48.47 a barrel by 8:54 GMT.
Oil prices will need to ration US shale growth as the marginal source of non-OPEC production, and despite the recent slowing of US rig count growth we still expect shale production growth to accelerate over the course of H2 due to investment decisions were already taken during H1. Lower prices would obviously squeeze shale investment economics (and eventually production) in coming months in order to rebalance the market.
While crude oil implied volatilities moved moderately higher this week, the term structure of implied volatility shifting upwards by approximately 1% for both Brent and WTI options. 12-month at-the-money implied volatility on WTI is now above 30%, the highest level since the December 2016 OPEC meeting. Meanwhile, ATM IV levels on WTI JUN18 options are currently trending higher above 31%, moderately higher than the levels recorded on the DEC18 contract.
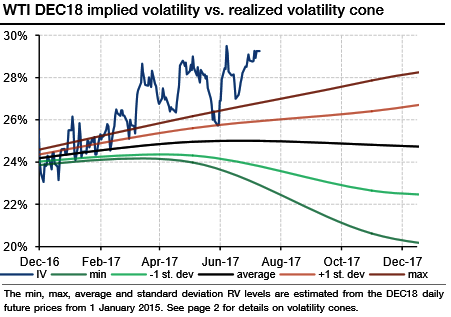
Compared to realized volatilities, long-dated WTI and Brent options seem expensive. The bottom-left chart below plots WTI ATM implied volatilities for options written on the DEC18 contract, alongside with the historically realized volatility cone.
Volatility cones are developed with a view to enabling to compare implied volatility levels with realized volatility sampled over time periods corresponding to the remaining time to maturity of the options. At 29.25%, ATM DEC18 implied volatility is currently 5 percentage points above the average 18-month realized volatility (black line), and 2.5 percentage points above the maximum 18-months realized volatility level recorded since January 2015.


