


 FxWirePro: AUD/USD remains buoyant, looks to extend gains
  Aussie Strength Prevails: AUD/JPY Targets Multi-Year Highs as Bullish Momentum Builds
  FxWirePro: USD/CAD gains some ground but bearish outlook persists
  FxWirePro: GBP/NZD down trend loses steam, remains on bearish path
  FxWirePro: USD/JPY neutral in the near-term, scope for downward resumption
  Trump’s Hardline Stance Rattles Markets: BTC/USD Faces Volatility but Technicals Signal Strength
  FxWirePro- Woodies pivot (Major)
  FxWirePro: USD/CNY hovers near three-year low, scope for further downside
  FxWirePro: USD/CNY hits fresh three-year low, scope for further downside
  FxWirePro- Major Pair levels and bias summary
  CADJPY Outlook: Loonie Limps as Dismal Jobs Data Fuels BoC Rate Cut Bets
  Ethereum Technical Outlook: ETH Braces for Support as Bulls Eye the USD 2,200 Buy Zone
  FxWirePro: AUD/USD soften slightly but trend is still bullish
  Bitcoin Targets USD 90,000: Bullish Sentiment Solidifies as Realized Profits Surge
  FxWirePro: GBP/USD rises as UK political uncertainty fails to dent pound strength
  FxWirePro- Major Crypto levels and bias summary


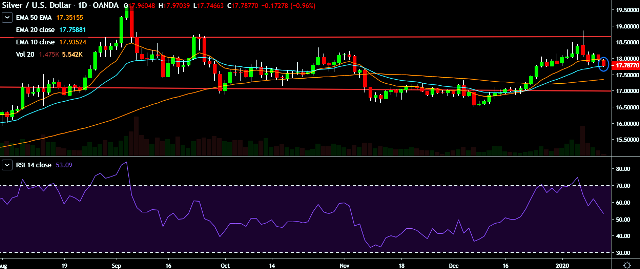
- XAG/USD is currently trading around $17.78 marks.
- It made intraday high at $17.97 and low at $17.74 levels.
- Intraday bias remains slightly bearish for the moment.
- A daily close above $17.97 will test key resistances at $18.08, $18.32, $18.40, $18.87, $18.98, $19.08 and $19.24 marks respectively.
- On the other side, a daily close below $17.76 will take the parity down towards key supports at $17.62, $17.40 and $17.17 marks respectively.
- Important to note here that 20D, 30D and 55D EMA heads up and confirms the bullish trend in a daily chart. Current downside movement is short term trend correction only.
We prefer to take short position on XAG/USD around $17.80, stop loss at $18.02 and target of $17.40.


