


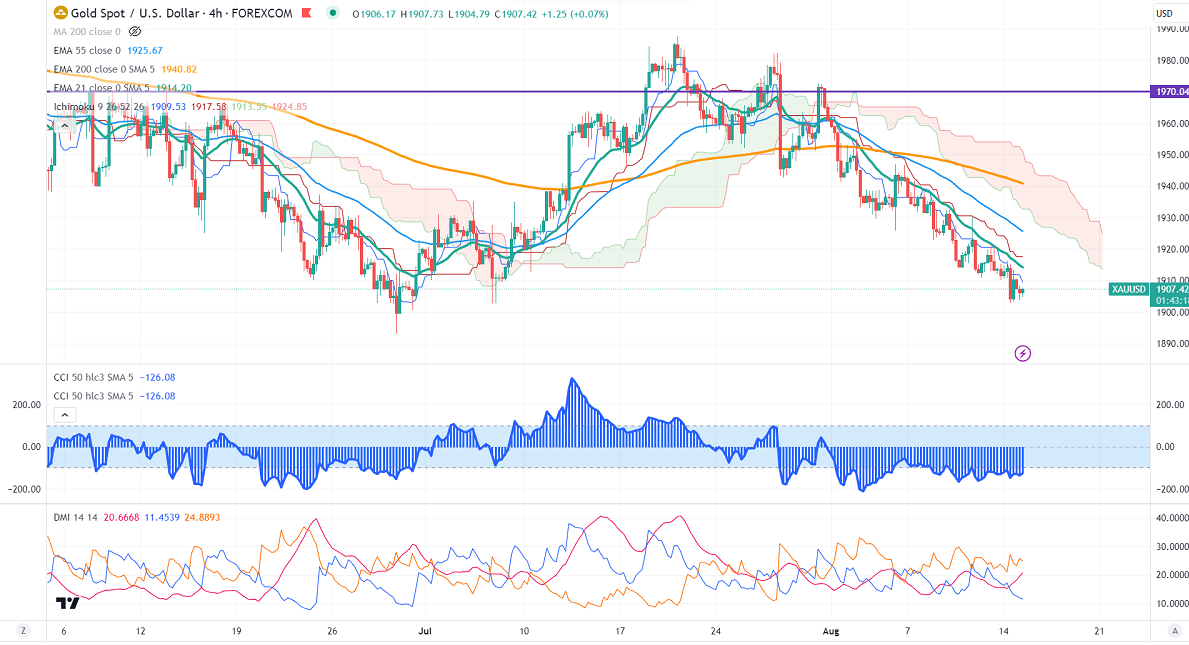
Ichimoku Analysis (4- Hour chart)
Tenken-Sen- $1911.78
Kijun-Sen- $1917.58
Gold continues to decline for a third consecutive week on a strong US dollar. It hit a low of $1902.77 yesterday and is currently trading around $1906.63.
Last week, US annual CPI rose slightly below forecast. But US PPI edged higher above estimate. The slight increase in inflation increased the chance of a Fed rate hike.
Major economic data for the day
Aug 15th, 2023, US Core retail sales m/m (12:30 pm GMT)
Canada CPI m/m (12:30 pm GMT)
US dollar index- Bullish. Minor support around 102/101. The near-term resistance is 103.50/105.
According to the CME Fed watch tool, the probability of a no-rate hike in Sep decreased to 88.5% from 85% a week ago.
The US 10-year yield hits multi-week in hopes of a further rate hike by Fed. The US 10 and 2-year spread narrowed to -76% from -110%.
Factors to watch for gold price action-
Global stock market- bullish (negative for gold)
US dollar index - Bullish (bearish for gold)
US10-year bond yield- Bullish (negative for gold)
Technical:
The near–term support is around $1900, a break below targets of $1885/$1867. The yellow metal faces minor resistance around $1950 and a breach above will take it to the next level of $1955/$1970/$1985.
It is buy on dips around $1900 with SL around $1890 for TP of $1950


