


 BTCUSD Coils in Tight Range: Will Geopolitical Stability Trigger a Breakout Toward $80,000?
  FxWirePro- Major Crypto levels and bias summary
  Bitcoin Retreats Toward Critical Support as Geopolitical Winds Shift
  FxWirePro- Major Crypto levels and bias summary
  Bitcoin Retreats as Geopolitical Tensions Flare: BTC/USD Dips Following Iran’s Rejection of Ceasefire
  FxWirePro- Major Crypto levels and bias summary


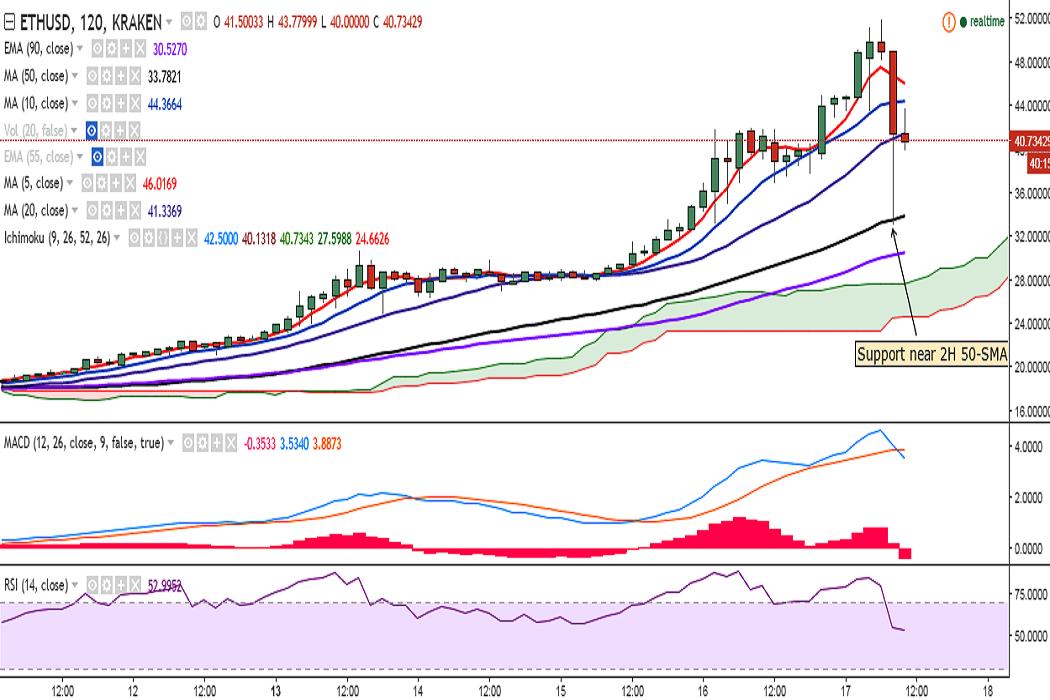
ETH/USD broke above the 50 mark on Friday and hit a fresh all-time high at 51.90 levels. However, it failed to hold its strength and dropped to 33.10 levels. It is currently trading at 40 levels at the time of writing (Kraken).
Ichimoku analysis of daily chart:
Tenkan Sen: 30.28
Kijun Sen: 28.61
With the recent price surge, the market cap of Ethereum moved closer to $5 billion. It is currently stands at $3.95 billion.
The pair is trading in the red and has taken support near 2H 50-SMA. Traders are advised to wait for a clear signal on the intraday charts.
On the upside, resistance is seen at 45.97 levels (161.8% extension of 5.92 and 30.67 rally) and a break above would see it testing 51.90 (today’s high)/55.43.
On the flipside, support is seen at 33.49 (2H 50-SMA) and a break below would target 30.29 (2H 90-EMA)/28.91 (50% retracement of 5.92 and 51.90 rally).

- News

- Economy

- Central Banks
- Investing
- Research
- Roundups
- Digital Currency
- Insights
- Technical Analysis
- Technology
- Business
- Law
- Health
- Nature
- Fintech
- Science
- Topic
- Opinions
- ©Econometrics LLC . All Rights Reserved.
FxWirePro: ETH/USD briefly breaches 50 and plunges, finds support near 2H 50-SMA
Friday, March 17, 2017 11:24 AM UTC
Editor's Picks


- Market Data
Most Popular


