


 Ethereum Retreats in Bitcoin’s Shadow: ETH/USD Tests Critical Support at USD 2,075
  Ethereum Trails Bitcoin’s Retreat: Key Support Levels in Focus
  BTCUSD Coils in Tight Range: Will Geopolitical Stability Trigger a Breakout Toward $80,000?
  Bitcoin Retreats Toward Critical Support as Geopolitical Winds Shift
  FxWirePro- Major Crypto levels and bias summary
  Bitcoin Retreats as Geopolitical Tensions Flare: BTC/USD Dips Following Iran’s Rejection of Ceasefire


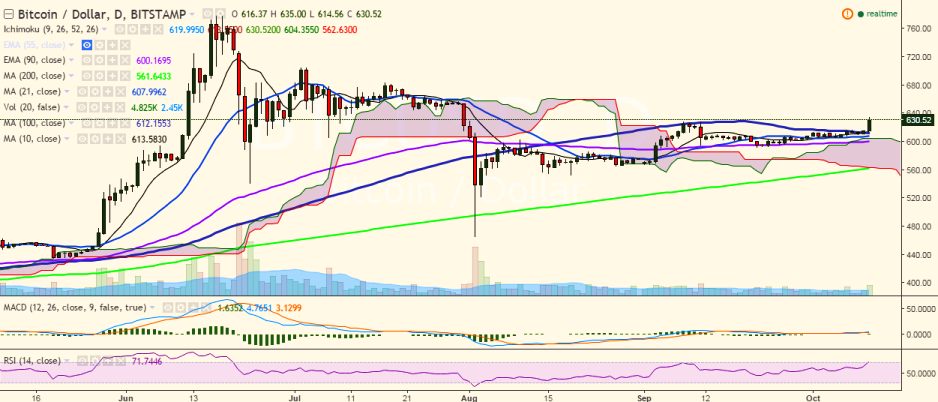
BTC/USD is riding high on the back of newly found momentum and has broken above previous high of 628.99 levels. It is currently trading at 631 levels (Bitstamp).
Long-term trend: Bullish
Short-term trend: Bullish
Ichimoku analysis of daily chart:
Tenkan Sen: 610.99
Kijun Sen: 604.54
Trend reversal: 599.48 (90 EMA)
The pair is trading well above 100-day MA and will now face resistance at 651.79 (161.8% retracement of 628.99 and 592.10) and a break above would target 704.99 (July 03 high)/ 736 (113% retracement of 704.99 and 465.28).
On the other hand, support is likely to be found at 612.43 (100-day MA) and a break below would target 599.11 (90 EMA)/552.30 (August 19 low).

- News

- Economy

- Central Banks
- Investing
- Research
- Roundups
- Digital Currency
- Insights
- Technical Analysis
- Technology
- Business
- Law
- Health
- Nature
- Fintech
- Science
- Topic
- Opinions
- ©Econometrics LLC . All Rights Reserved.
FxWirePro: BTC/USD skyrockets, good to buy on dips
Tuesday, October 11, 2016 10:04 AM UTC
Editor's Picks


- Market Data
Most Popular


