


 Bitcoin Retreats Toward Critical Support as Geopolitical Winds Shift
  Ethereum Retreats in Bitcoin’s Shadow: ETH/USD Tests Critical Support at USD 2,075
  Ethereum’s $2,200 Ceiling: Can Diplomatic Breakthroughs Dissolve the Bearish Resistance?
  BTCUSD Coils in Tight Range: Will Geopolitical Stability Trigger a Breakout Toward $80,000?
  FxWirePro- Major Crypto levels and bias summary


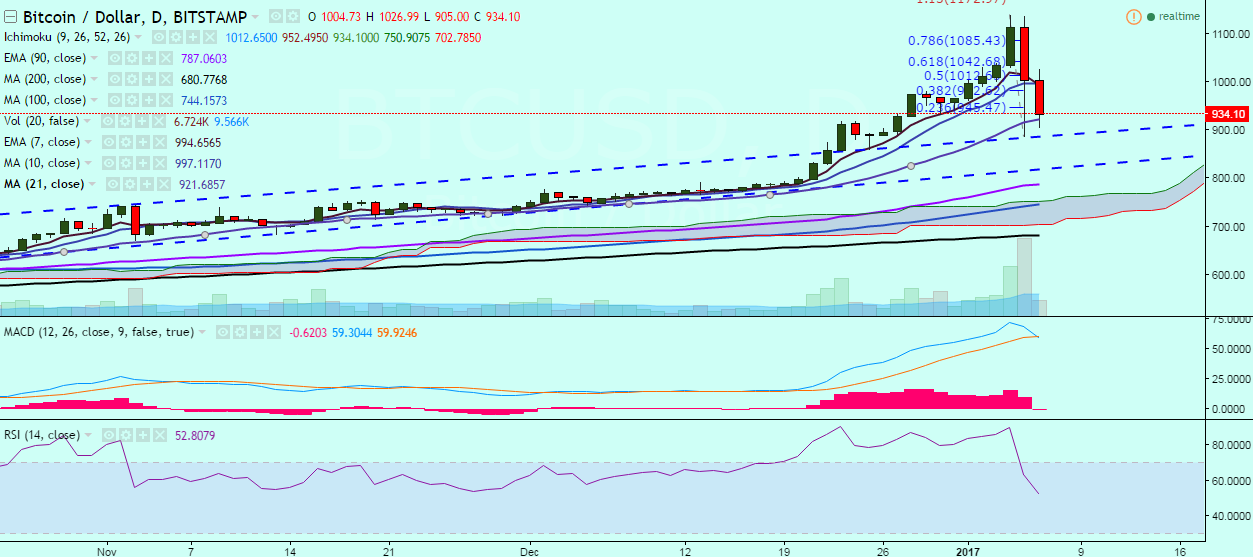
BTC/USD continues to trade in the red on Friday at it failed to break above 1,140 levels. It has broken below 1,000 levels and is currently trading at 931 levels at press time (Bitstamp).
Ichimoku analysis of daily chart:
Tenkan Sen: 1012.65
Kijun Sen: 951.95
Trend reversal: 783.75 (90 EMA)
On the upside, the pair faces immediate resistance at 996 (10-day MA) and a break above would see it testing 1,042 (61.8% retracement of 1139.89 and 885.41)/1085 levels. Further bullishness in the pair could be confirmed only if it breaks above 1,140 levels (January 04 high).
Momentum studies have turned bearish with RSI(14) rolling over from overbought levels. Also, MACD is on the verge of a bearish crossover.
On the reverse side, the pair plunged to 885.41 (trend line joining 628.99 and 745.19). Today, it has taken support near 21-day MA (914 levels) and a consistent break below would target yesterday’s low of 885 levels/849.70 (61.8% retracement of 670.32 and 1139.89).

- News

- Economy

- Central Banks
- Investing
- Research
- Roundups
- Digital Currency
- Insights
- Technical Analysis
- Technology
- Business
- Law
- Health
- Nature
- Fintech
- Science
- Topic
- Opinions
- ©Econometrics LLC . All Rights Reserved.
FxWirePro: BTC/USD rejected at 1,140, good to short on decisive break below 21-DMA
Friday, January 6, 2017 10:06 AM UTC
Editor's Picks


- Market Data
Most Popular


