


 BTCUSD Coils in Tight Range: Will Geopolitical Stability Trigger a Breakout Toward $80,000?
  Bitcoin Retreats Toward Critical Support as Geopolitical Winds Shift
  FxWirePro- Major Crypto levels and bias summary
  Ethereum Retreats in Bitcoin’s Shadow: ETH/USD Tests Critical Support at USD 2,075
  Bitcoin Retreats as Geopolitical Tensions Flare: BTC/USD Dips Following Iran’s Rejection of Ceasefire


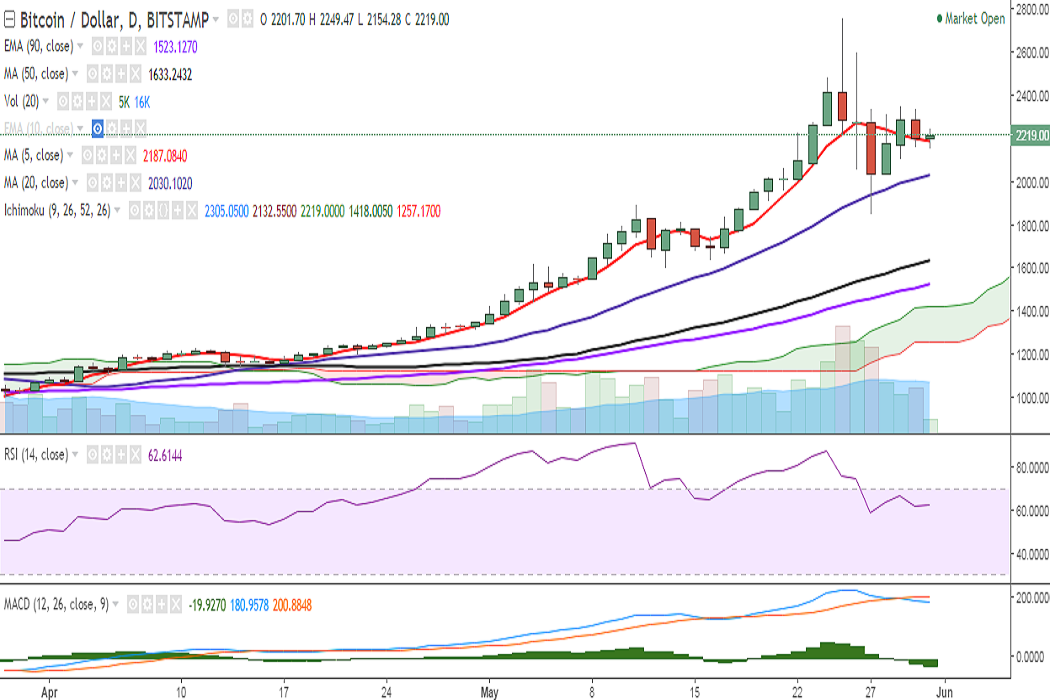
BTC/USD is trading in a narrow range on Wednesday and its upside is being capped by 2354 (200% extension of 891.33 and 1623.01). It is currently trading at 2227 levels at the time of writing (Bitstamp).
Ichimoku analysis of daily chart:
Tenkan Sen: 2305.05
Kijun Sen: 2132.55
On the upside, the pair faces strong resistance 2305 (50% retracement of 2760 and 1850) and a break above would target 2354 (200% extension of 891.33 and 1623.01)/2412 (61.8% retracement of 2760 and 1850)/2481 (May 24 high).
RSI is holding above 50, however, MACD line is below signal line, and stochs suggest lower bias. Traders are preferred to wait for a confirmed signal on daily charts. Momentum studies suggest bearish bias on the 2-hour and 4-hour charts.
On the hourly charts, the pair is currently hovering around 2201 (2h 50-SMA) and a decisive break below would see a dip till 2180 (50% retracement of 1601.46 and 2760)/2085 (2h 200-SMA). Further weakness would confirm bearishness in the pair, dragging it to 1850 (May 27 low).

- News

- Economy

- Central Banks
- Investing
- Research
- Roundups
- Digital Currency
- Insights
- Technical Analysis
- Technology
- Business
- Law
- Health
- Nature
- Fintech
- Science
- Topic
- Opinions
- ©Econometrics LLC . All Rights Reserved.
FxWirePro: BTC/USD rangebound, break below 2h 200-SMA confirms bearishness
Wednesday, May 31, 2017 9:25 AM UTC
Editor's Picks


- Market Data
Most Popular


