


 Crypto Alpha Command: BTC & ETH derivatives Intelligence
  ETHUSD Surges Past $2700 on Strong Institutional Demand, Technicals Show Bullish Crossover Despite Cooling ETF Inflow Momentum
  FxWirePro-24-Hour Crypto Category-Based Performance Dashboard


 Add as a preferred source on Google
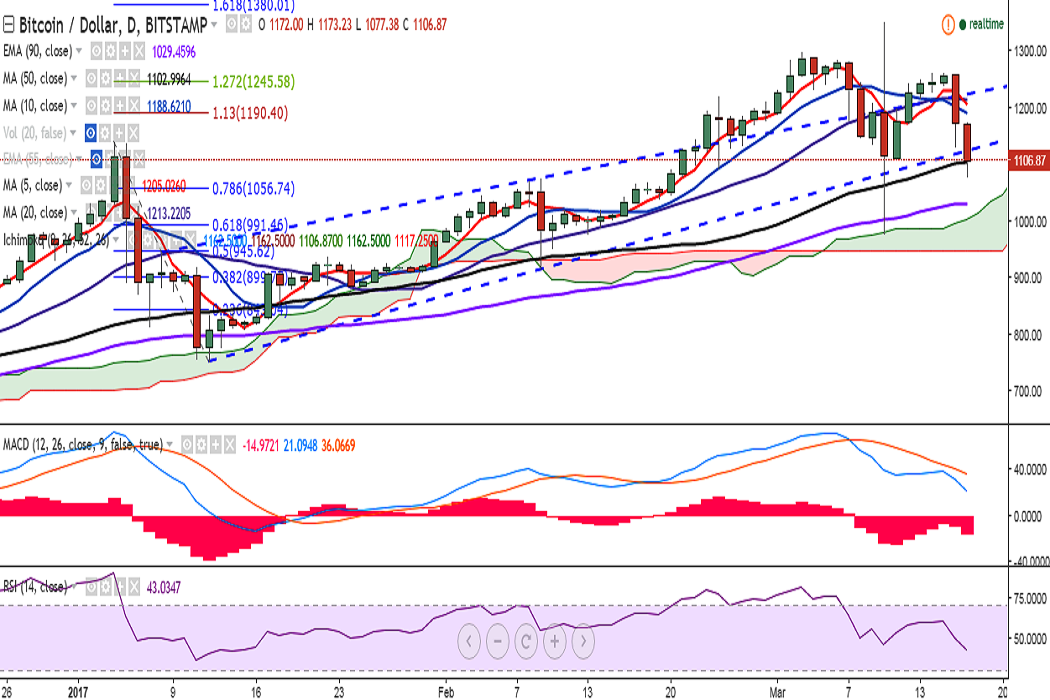
BTC/USD continues to trade in the red on Friday. The pair dropped to 1077 levels before restoring strength to 1109 levels, where it currently trades (Bitstamp).
Ichimoku analysis of daily chart:
Tenkan Sen: 1162.50
Kijun Sen: 1162.50
Momentum studies have turned bearish for the pair: RSI(14) is at 45, bias lower; and the MACD line is below the signal line.
On the topside, resistance is seen at 1139.89 (January 04 high) and a break above would target 1190.40 (113% retracement of 1139.89 and 751.34)/1215 (20-DMA).
On the flipside, a close below 1099 levels (50-DMA) would further drag the pair till 1027.72 (90-EMA). Further weakness would suggest trend reversal and could see a dip till 980 (61.8% retracement of 751.34 and 1350).
CoinDesk reported that the recent plunge comes as bitcoin continues to face technical challenges – the ongoing scaling debate has not been able to develop a consensus so far. Also, the call for a hard fork has been increasing.

- News

- Economy

- Central Banks
- Investing
- Research
- Roundups
- Digital Currency
- Insights
- Technical Analysis
- Technology
- Business
- Law
- Health
- Nature
- Fintech
- Science
- Topic
- Opinions
- ©Econometrics LLC . All Rights Reserved.
FxWirePro: BTC/USD plunges to 1077, close below 50-DMA targets 1027
Friday, March 17, 2017 8:54 AM UTC
Editor's Picks



- Market Data
Most Popular




