


 Bitcoin Retreats as Geopolitical Tensions Flare: BTC/USD Dips Following Iran’s Rejection of Ceasefire
  BTCUSD Coils in Tight Range: Will Geopolitical Stability Trigger a Breakout Toward $80,000?
  Bitcoin Retreats Toward Critical Support as Geopolitical Winds Shift
  FxWirePro- Major Crypto levels and bias summary
  FxWirePro- Major Crypto levels and bias summary
  FxWirePro- Major Crypto levels and bias summary
  Ethereum Trails Bitcoin’s Retreat: Key Support Levels in Focus


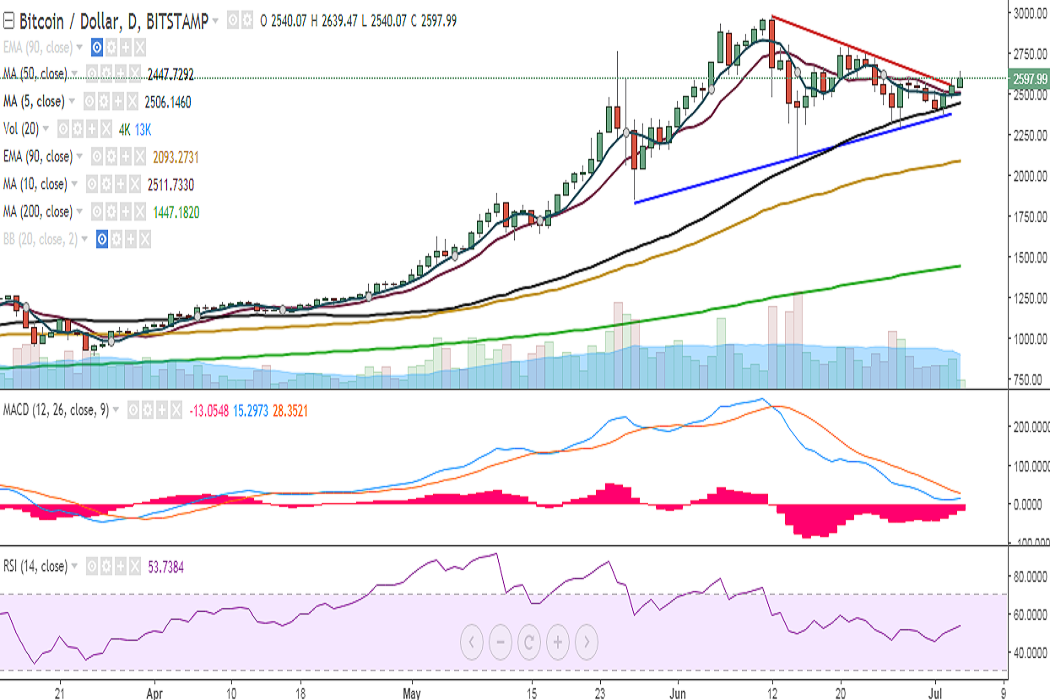
BTC/USD broke above the major trend line resistance joining 2980 and 2789 and is currently trading at 2620 levels at the time of writing (Bitstamp).
Ichimoku analysis of daily chart:
Tenkan Sen: 2465.23
Kijun Sen: 2550
On the upside, the pair now faces resistance at 2651 (61.8% retracement of 2980 and 2120) and a break above would target 2682 (78.6% retracement of 2789 and 2291)/2760 (May 25). Further strength would target 2789 (June21 high)/2853.
On the downside, support is seen at 2557 (20-DMA) and any violation would target 2509 (5-DMA)/2447 (50-DMA). Further weakness would drag it to 2415 (Cloud top)/2389 (trend line joining 1850 and 2120).
Momentum studies: On the daily chart, RSI is strong at 54 and stochs are biased higher. MACD appears to be on the verge of a bullish crossover.
On the weekly chart, the pair is hovering around 5-SMA, with RSI strong at 74 and the MACD line above the signal line. A close above 5-SMA would confirm further upside in the pair.
On the 4-hour chart, the pair is trying to hold above 2609 (4h 200-SMA). RSI is at 61, MACD line is above the signal line, and stochs are in the overbought zone.
FxWirePro launches Absolute Return Managed Program. For more details, visit http://www.fxwirepro.com/invest


