


 Ethereum’s $2,200 Ceiling: Can Diplomatic Breakthroughs Dissolve the Bearish Resistance?
  BTCUSD Coils in Tight Range: Will Geopolitical Stability Trigger a Breakout Toward $80,000?
  Ethereum Retreats in Bitcoin’s Shadow: ETH/USD Tests Critical Support at USD 2,075
  Bitcoin Retreats Toward Critical Support as Geopolitical Winds Shift
  FxWirePro- Major Crypto levels and bias summary


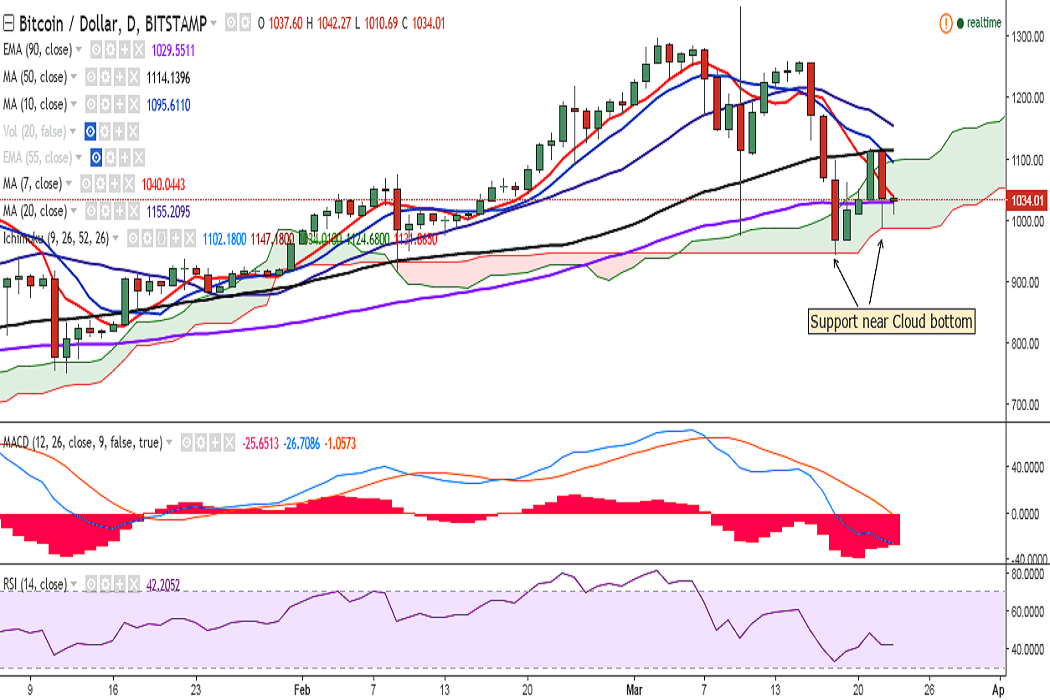
BTC/USD broke below 90-EMA on Wednesday and fell to 988 levels. It has formed a doji candle today and is currently trading at 1034 levels at the time of writing (Bitstamp).
Ichimoku analysis of daily chart:
Tenkan Sen: 1102.18
Kijun Sen: 1147.18
The pair is currently trading a little over 90-EMA and faces resistance at 1059.84 (7-DMA). A consistent break above would see it testing 1099.31 (38.2% retracement of 1350 and 944.36)/1113.13 (10-DMA).
Momentum studies suggest bearish bias for the pair: RSI(14) is weak at 42; and MACD line is below signal line.
Cloud bottom is acting as a major support for the pair and a close below 1029.45 (90-EMA) would target 985.67 (Cloud bottom). Further weakness could see a dip till 944.36 (March 18 low)/ 913.73 (February 09 low).

- News

- Economy

- Central Banks
- Investing
- Research
- Roundups
- Digital Currency
- Insights
- Technical Analysis
- Technology
- Business
- Law
- Health
- Nature
- Fintech
- Science
- Topic
- Opinions
- ©Econometrics LLC . All Rights Reserved.
FxWirePro: BTC/USD holds cloud support, break below targets 944
Thursday, March 23, 2017 10:00 AM UTC
Editor's Picks


- Market Data
Most Popular


