


 FxWirePro- Major Crypto levels and bias summary
  Ethereum Retreats in Bitcoin’s Shadow: ETH/USD Tests Critical Support at USD 2,075
  FxWirePro- Major Crypto levels and bias summary
  Bitcoin Retreats as Geopolitical Tensions Flare: BTC/USD Dips Following Iran’s Rejection of Ceasefire
  FxWirePro- Major Crypto levels and bias summary
  Ethereum’s $2,200 Ceiling: Can Diplomatic Breakthroughs Dissolve the Bearish Resistance?
  BTCUSD Coils in Tight Range: Will Geopolitical Stability Trigger a Breakout Toward $80,000?


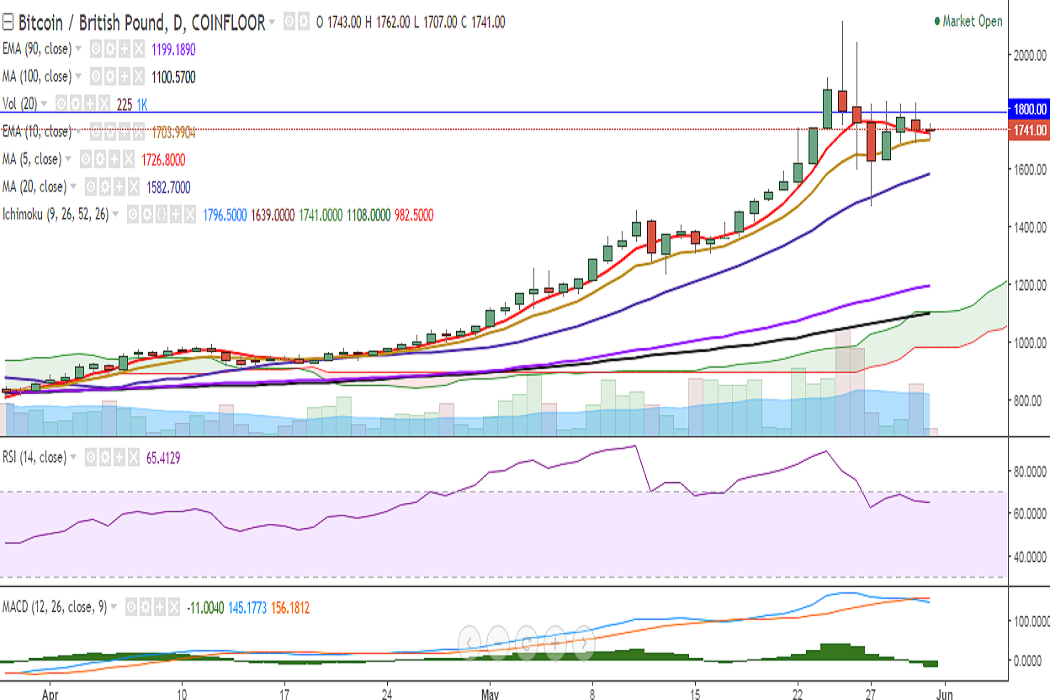
BTC/GBP failed to close above 1800 levels on Tuesday. It is currently hovering around 7-DMA at 1729 levels at the time of writing (Coinfloor).
Ichimoku analysis of daily chart:
Tenkan Sen: 1796.50
Kijun Sen: 1639
The pair is currently trading in a narrow range and faces strong resistance at 1800 (psychological) and a break above would see it testing 1872 (61.8% retracement of 2118 and 1475)/1927 (161.8% extension of 706 and 1461)/1900/1980.
On the daily chart, RSI is at 67, MACD line is below signal line, and stochs suggest lower bias. Traders are preferred to wait for a confirmed signal on daily charts. Momentum studies suggest bearish bias on hourly charts.
Immediate support is seen at 1703 (10-EMA) and a break below would target 1663.54 (4h 90-EMA). Any violation would confirm further bearishness in the pair dragging it to 1582 (20-DMA)/1475 (May 27 low).

- News

- Economy

- Central Banks
- Investing
- Research
- Roundups
- Digital Currency
- Insights
- Technical Analysis
- Technology
- Business
- Law
- Health
- Nature
- Fintech
- Science
- Topic
- Opinions
- ©Econometrics LLC . All Rights Reserved.
FxWirePro: BTC/GBP holds above 10-EMA, bias neutral
Wednesday, May 31, 2017 9:54 AM UTC
Editor's Picks


- Market Data
Most Popular


