


 FxWirePro- Major Crypto levels and bias summary
  Bitcoin Retreats Toward Critical Support as Geopolitical Winds Shift
  Ethereum Trails Bitcoin’s Retreat: Key Support Levels in Focus
  Bitcoin Retreats as Geopolitical Tensions Flare: BTC/USD Dips Following Iran’s Rejection of Ceasefire
  Ethereum’s $2,200 Ceiling: Can Diplomatic Breakthroughs Dissolve the Bearish Resistance?
  FxWirePro- Major Crypto levels and bias summary


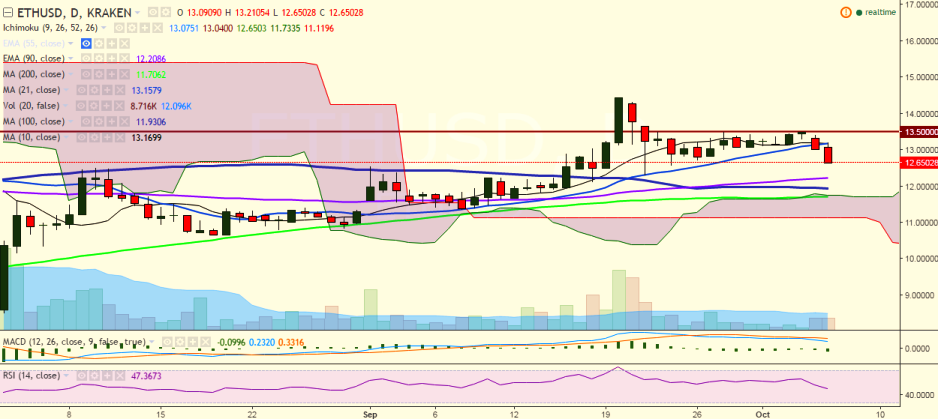
ETH/USD has declined sharply after hitting 13.50 levels and has hit a fresh low of 12.65 levels, where it currently trades (Kraken).
Long-term trend: Bullish
Short-term trend: Bearish
Ichimoku analysis of daily chart:
Tenkan Sen: 13.16
Kijun Sen: 12.96
Trend reversal: 12.19 (90 EMA)
“The pair has broken below 21-DMA and is trading well below this level. The pair is also trading below both Tenkan Sen and Kijun Sen, suggesting short-term bearish trend in the pair. So, a dip till 12.50 is likely”, FxWirePro said in a statement.
On the upside, the pair now sees strong resistance at 13.13 levels (21-DMA) and a break above would see the pair testing 13.50 (October 04 high)/ 14.02 (161.8% retracement of 13.50 and 12.65).
On the other hand, the pair is likely to find support near 12.55 (78.6% retracement of 12.30 and 13.50) and a break below would target 12.30 (September 22 low)/ 12.19 (90 EMA).

- News

- Economy

- Central Banks
- Investing
- Research
- Roundups
- Digital Currency
- Insights
- Technical Analysis
- Technology
- Business
- Law
- Health
- Nature
- Fintech
- Science
- Topic
- Opinions
- ©Econometrics LLC . All Rights Reserved.
ETH/USD plunges after hitting 13.50, dip till 12.50 likely
Thursday, October 6, 2016 10:45 AM UTC
Editor's Picks


- Market Data
Most Popular


