


 Bitcoin Retreats as Geopolitical Tensions Flare: BTC/USD Dips Following Iran’s Rejection of Ceasefire
  Ethereum’s $2,200 Ceiling: Can Diplomatic Breakthroughs Dissolve the Bearish Resistance?
  FxWirePro- Major Crypto levels and bias summary
  FxWirePro- Major Crypto levels and bias summary


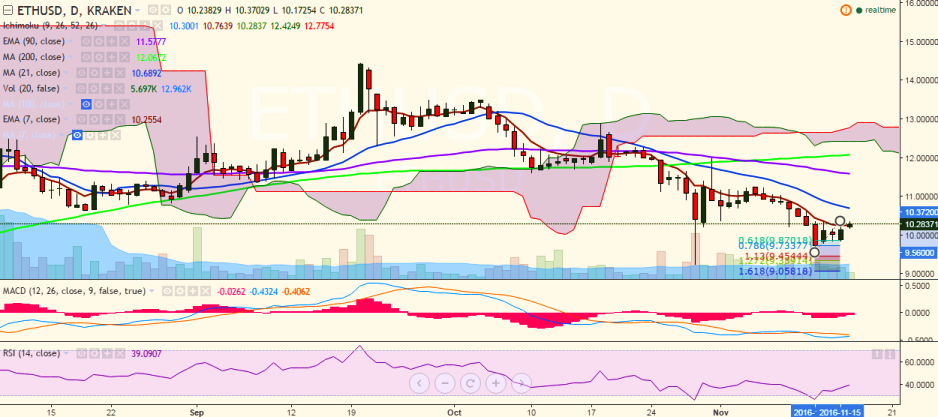
ETH/USD is struggling for a consistent break above 7-EMA and is hovering around this level. It is currently trading at 10.32 levels at press time (Kraken).
Ichimoku analysis (Daily chart):
Tenkan-Sen: 10.30
Kijun-Sen: 10.76
Trend reversal: 11.60 (90 EMA)
On the upside, a consistent break above 10.24 (7 EMA) would see the pair testing 10.74 (21-day MA)/ 11.24 (November 05 high). Bullishness in the pair could be confirmed only if it breaks above 12.00 levels (October 31 high).
On the downside, support is seen at 9.87 (61.8% retracement of 9.56 and 10.37) and a break below would see a dip till 9.56 (November 12 low)/9.23 (Oct 29 low).

- News

- Economy

- Central Banks
- Investing
- Research
- Roundups
- Digital Currency
- Insights
- Technical Analysis
- Technology
- Business
- Law
- Health
- Nature
- Fintech
- Science
- Topic
- Opinions
- ©Econometrics LLC . All Rights Reserved.
ETH/USD hovers around 7-EMA, close above targets 11.24
Wednesday, November 16, 2016 11:30 AM UTC
Editor's Picks


- Market Data
Most Popular


